


Nikki Wilson, Pharm.D., MBA
Senior Director, Clinical Pharmacy Services
Download the Snapshot
A Closer Look at a High-Impact Therapeutic Class
Topical Medication Trends
Building on our broader 2025 Drug Trends analysis, this section narrows the lens to the topical therapeutic class—a category that continues to command outsized attention due to its disproportionate cost impact relative to prescription volume. Examining utilization and spend across both in-network and out-of-network channels—including retail pharmacies, mail-order services, and paper-based medical bill submissions—this analysis captures the full scope of topical prescribing patterns that extend beyond traditional pharmacy benefit management reporting.
While in-network data reflects the effectiveness of integrated clinical controls and formulary management, out-of-network topical trends expose significant pricing anomalies, opportunistic product proliferation, and jurisdictional factors that complicate cost containment. Together, these perspectives reveal where topical spend is concentrated, what's driving cost inflation, and where targeted interventions can promote clinically-appropriate prescribing while delivering meaningful cost reductions.
Proportion of Topical Therapeutic Class by Network
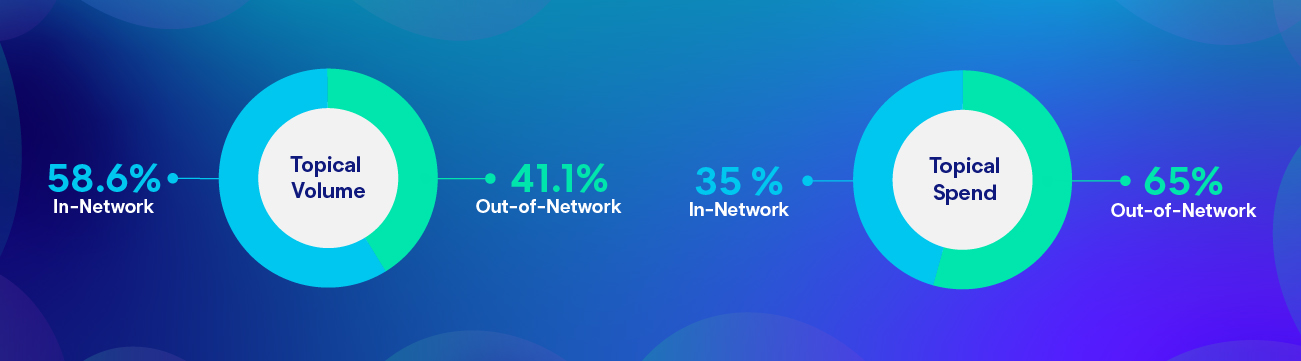
While in-network channels process the majority of topical scripts (58.6%) and account for only 35% of spend, out-of-network channels tell the opposite story—just 41.1% of volume driving 65% of all topical spend. This cost-to-volume imbalance points to inflated pricing and opportunistic prescribing concentrated in out-of-network channels, not higher utilization. Programs that prioritize network steerage and extend clinical oversight into out-of-network channels are best positioned to meaningfully reduce topical spend while maintaining clinically appropriate care.
Overall Topical Trends
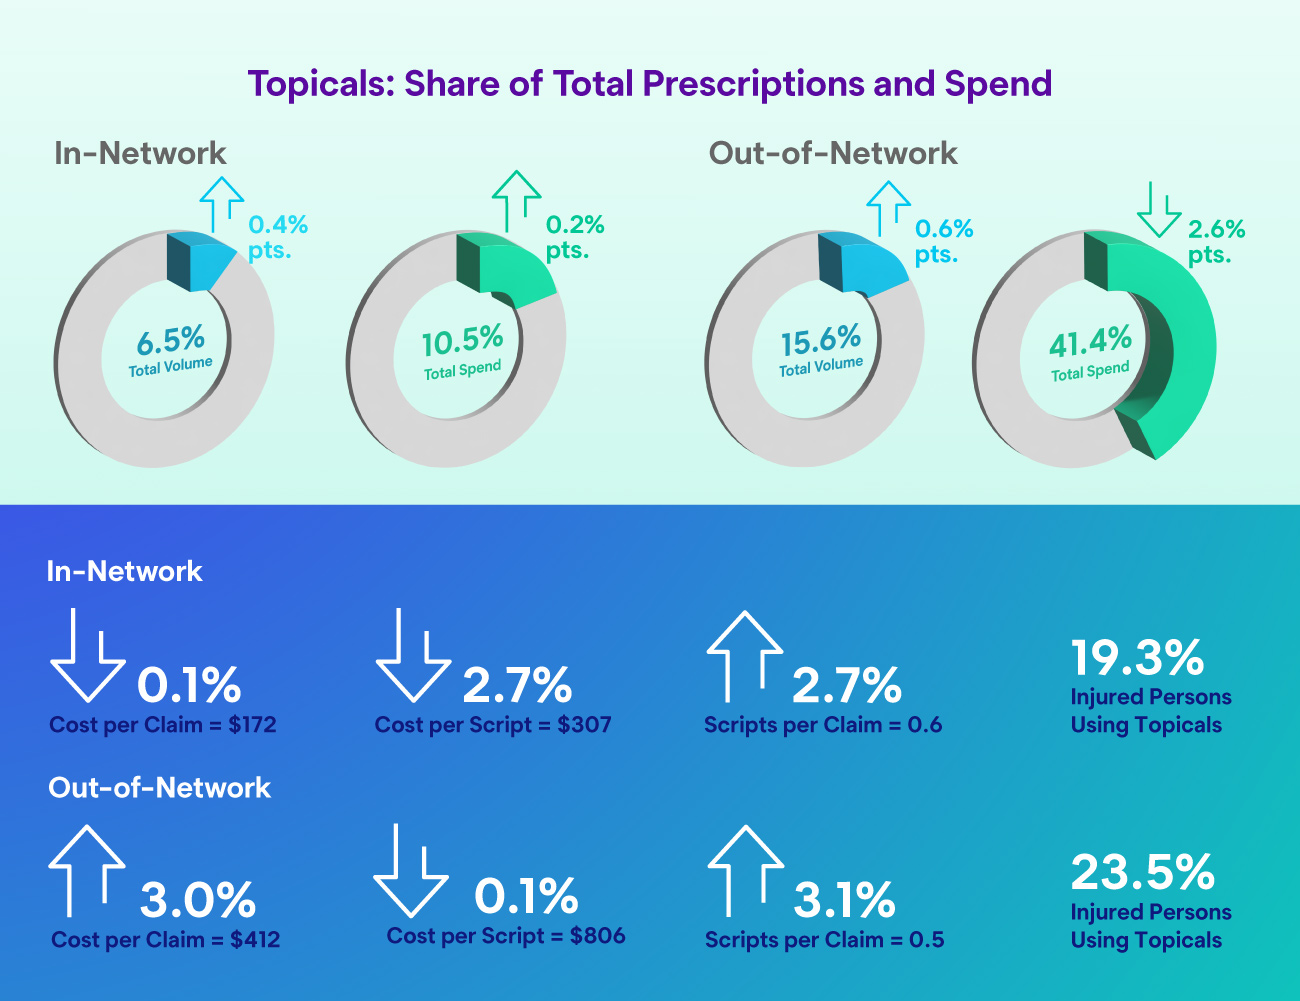
In 2025, the number of injured persons using topical medications (regardless of network type) rose 3.8% to 21.9%. This trend combined with overall increases in topical scripts and costs, particularly within out-of-network channels, revealed a continued upward trend experienced over the last seven years.
Top Three Topicals by Spend
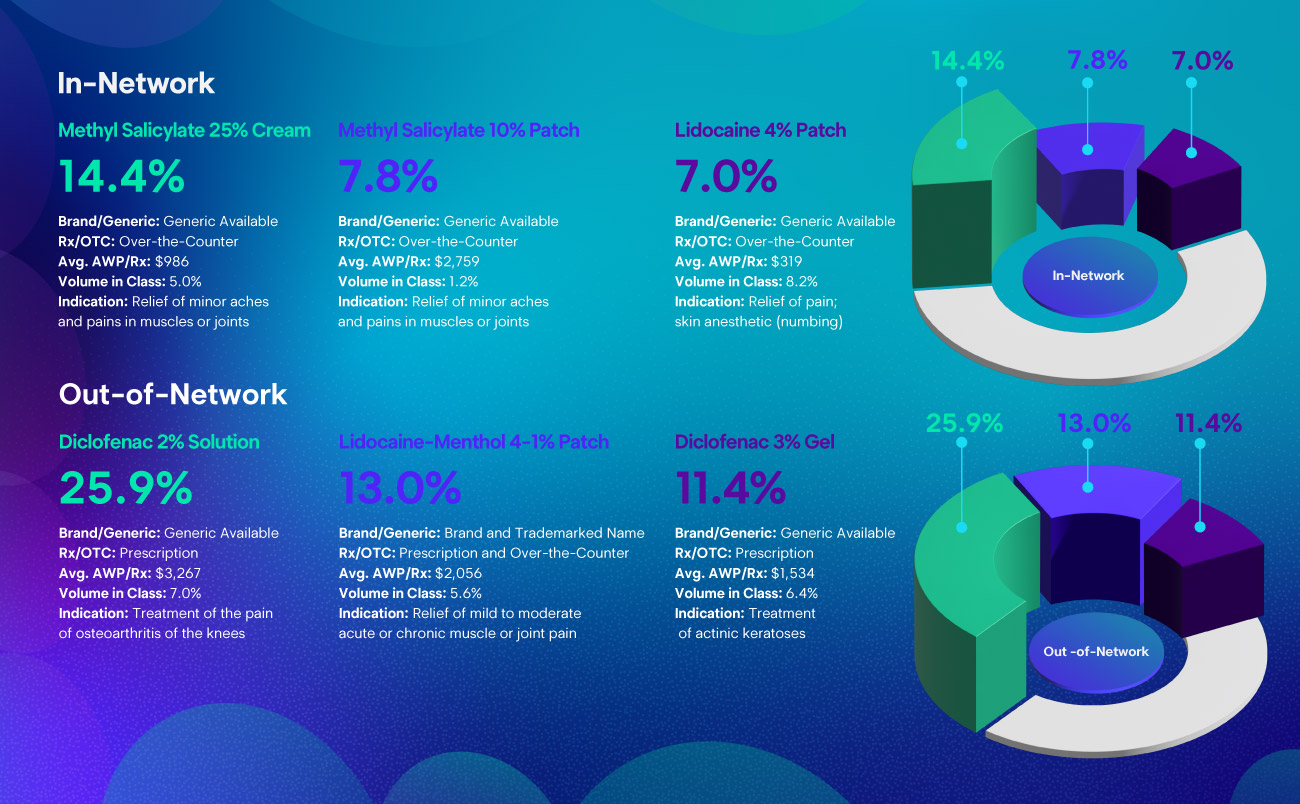
The top three topicals by spend look markedly different across network channels. In-network, the highest-spend products are over-the-counter generics with moderate average costs. Out-of-network, spend is concentrated in high-cost prescription products—averaging $1,534 to $3,267 per script—that drive disproportionate cost on low volume. With generic and lower-cost therapeutic alternatives available for many of these products, this spend represents a significant opportunity for clinical intervention, formulary management, and network steerage to redirect utilization toward more cost-effective options.
Top 3 States by Out-of-Network Topical Spend
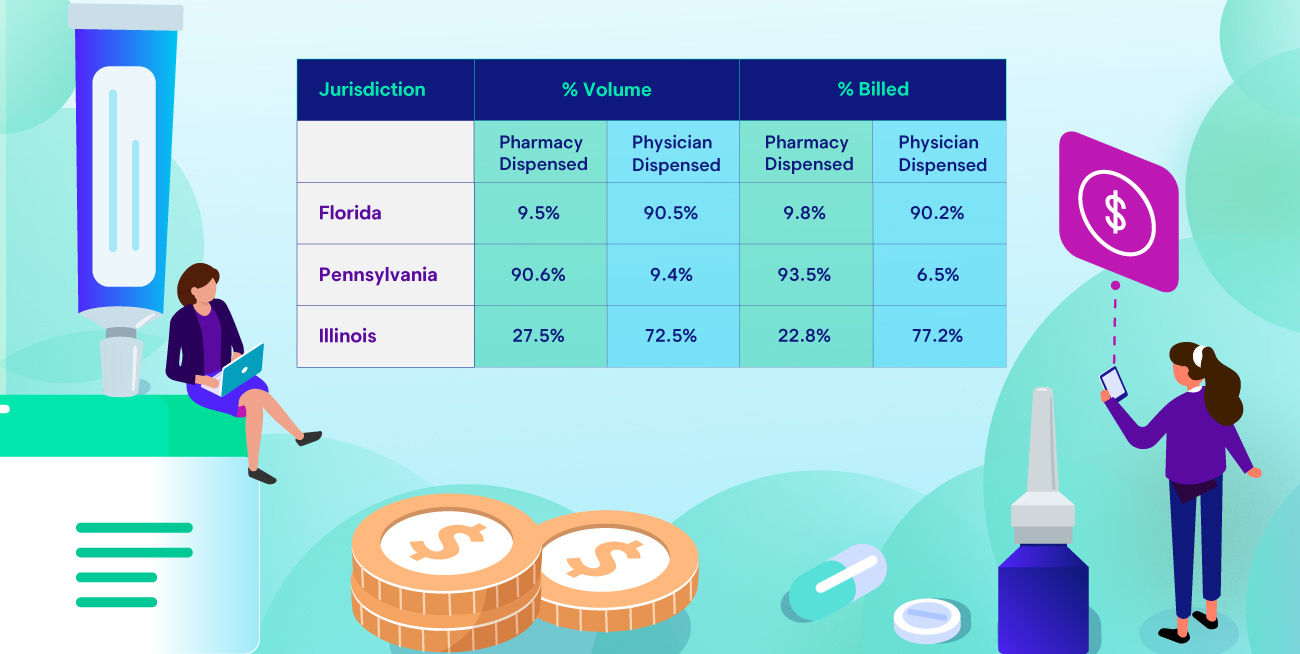
Florida, Pennsylvania, and Illinois represent the jurisdictions with the highest billed amounts for out-of-network topicals in the dataset, driven significantly by state-specific regulatory frameworks governing physician dispensing and pharmacy direction of care. Two of the three jurisdictions permit broad physician dispensing privileges, resulting in higher out-of-network volume and spend through prescriber-dispensed medications. The third jurisdiction, while more restrictive on physician dispensing, saw out-of-network topical spend driven primarily by out-of-network pharmacy billing—particularly through mail order services, some of which directly market to injured employees and personal injury populations.
Trending Topical Categories of Interest
The following section highlights two trending topical categories identified under our opportunistic product classification—a designation applied to products that are priced significantly above their therapeutic value, often offering little-to-no clinical advantage over standard or over-the-counter (OTC) alternatives, and are frequently associated with abusive prescribing and billing practices. The two categories examined here are Prescription Topical Analgesics (RxTAs), which carry specific, limited FDA-approved indications and often include high-cost second- and third-line agents as well as products with approved uses unrelated to workers' compensation, and Private-Label Topical Analgesics (PLTAs), which are branded products not recommended as first-line therapy for which comparable OTC alternatives exist.
It is important to note that not all RxTAs are classified as opportunistic products. However, the data makes clear where opportunistically priced products are driving the greatest cost exposure:
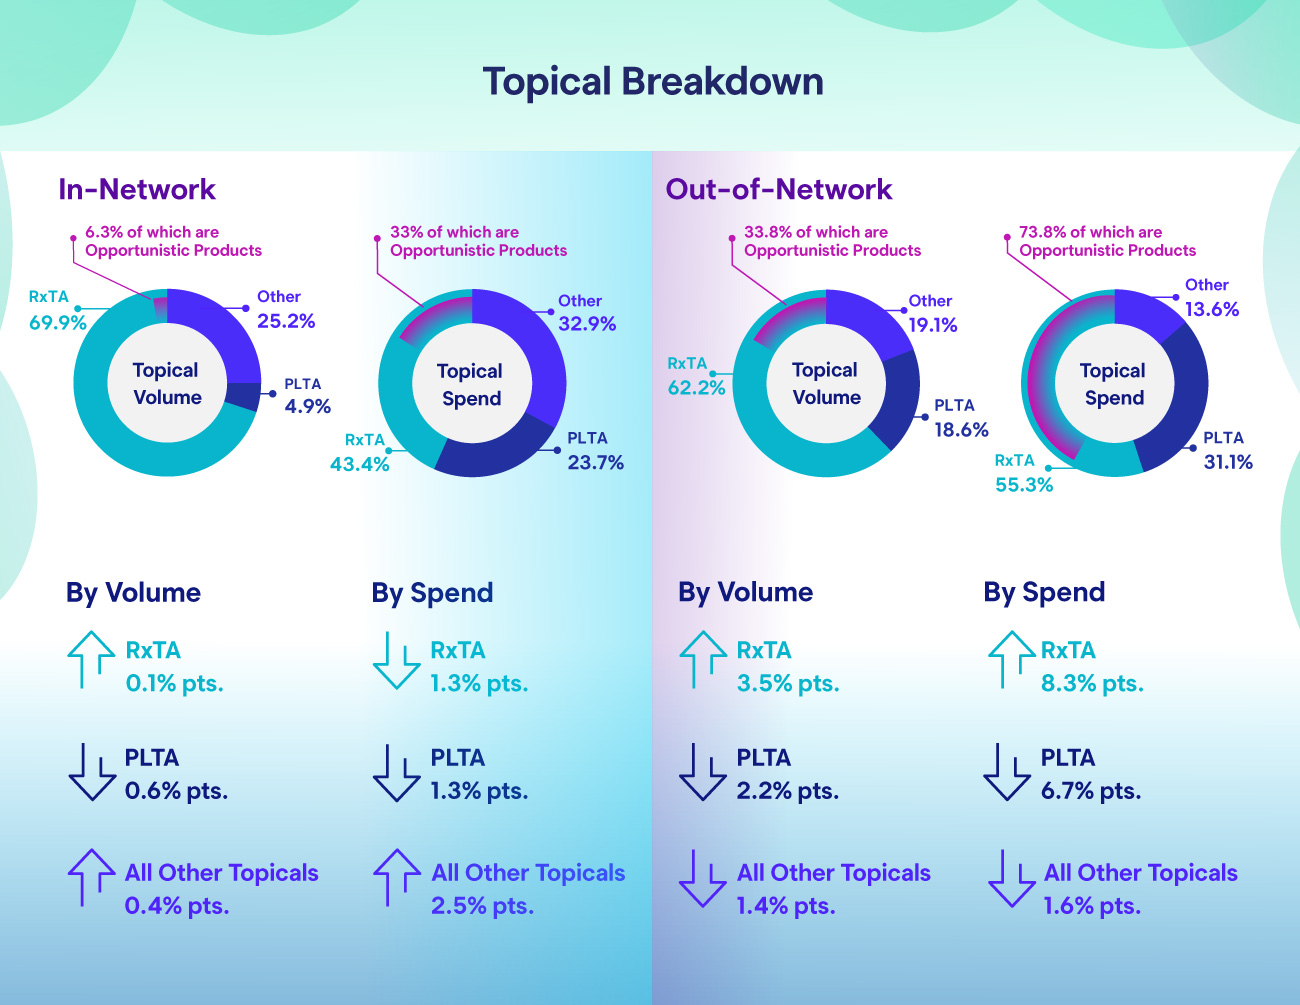
- Across all networks, opportunistic products make up less than 17% of total RxTA volume yet account for nearly two-thirds of total RxTA spend.
- Out-of-network channels are the primary driver, where opportunistic products account for nearly three-quarters of all RxTA spend with an additional 31.1% of topical spend coming from PLTAs.
- PLTA volume and spend are declining in out-of-network channels—a direct result of heightened industry awareness of their abusive nature—but this reduction is being offset by a sharp rise in opportunistic RxTA activity, signaling that bad actors are shifting tactics rather than exiting the market.
The most effective countermeasure is extending in-network clinical controls, such as formulary management, prior authorization, and clinical review to out-of-network prescription activity, ensuring that opportunistic prescribing is identified and addressed regardless of the channel in which it occurs.
Key Takeaways
Topicals continue to represent a high-cost, low-volume challenge—particularly in out-of-network channels, where 41.1% of script volume drives 65% of all topical spend.
- Out-of-network topical costs run more than 2.5 times higher per script and nearly 2.4 times higher per claim than in-network—despite comparable scripts-per-claim ratios—confirming that the cost gap is driven by pricing, not higher utilization.
- The percentage of injured persons using topicals rose 3.8% to 21.9% in 2025—continuing a seven-year upward trend—the cost pressure shows no signs of easing.
- Opportunistic products are the primary driver—including both opportunistic RxTAs and PLTAs—which together make up over halfof out-of-network topical volume yet account for the vast majority of out-of-network topical spend.
- Jurisdictional factors compound the issue, with Florida, Pennsylvania, and Illinois leading in out-of-network topical spend due to physician dispensing laws and pharmacy billing practices that create favorable conditions for inflated pricing.

Recommendations to Optimize Your Pharmacy Program
- Maximize network steerage—redirect topical utilization into prospectively managed channels where per script costs are less than half of what is billed out-of-network.
- Extend clinical programs to out-of-network activity—apply prior authorization, clinical review, and formulary edits to out-of-network scripts to close the gap where opportunistic prescribing thrives
- Monitor jurisdictional exposure—evaluate your book's concentration in states with broad physician dispensing privileges or aggressive out-of-network pharmacy billing patterns
- Challenge opportunistic product utilization—flag high-cost products with low clinical value and ensure therapeutic alternatives are being considered at the point of prescribing
- Leverage integrated pharmacy and medical bill review—ensure visibility across both in-network and out-of-network prescription activity to capture the full scope of topical spend

Want the full view of workers’ comp and auto pharmacy trends?
Explore Enlyte’s 2026 Drug Trends Analysis series for insights on retail and mail-order prescriptions, opioids, topicals, specialty medications, network patterns, and more.
Methodology Statement
This information is based on all 2025 calendar-year retail and mail-order transactions billed through Enlyte’s Pharmacy Benefit Management (PBM) program to provide a more complete and accurate analysis.