

Abusive Pricing and Opportunistic Categories

Nikki Wilson, Pharm.D., MBA
Senior Director, Clinical Pharmacy Services
Opportunistic Products:
Abusive Drug Pricing & Utilization Trends
This section of our drug trends analysis zeroes in on a critical subset of products we classify as "opportunistic"—pharmaceutical products that exploit pricing gaps and regulatory variability to drive disproportionate costs with little-to-no added clinical value. While opportunistic products represent a small fraction of overall prescription volume, their financial impact is significant: just 2.1% of in-network scripts account for 10.2% of in-network spend, while 11.3% of out-of-network scripts drive a staggering 45.5% of out-of-network costs. With nearly 69% of all opportunistic product spending occurring through out-of-network channels, this analysis examines utilization and cost trends across five key product categories—prescription topical analgesics (RxTAs), private-label topical analgesics (PLTAs), combination/convenience packs, compound kits, and other price outliers—to identify where targeted clinical and cost interventions can have the greatest impact. Understanding these trends is essential to building a proactive pharmacy management strategy that addresses fraud, waste, and abuse while ensuring patients receive clinically appropriate care.
Proportion of Opportunistic Product Category by Network
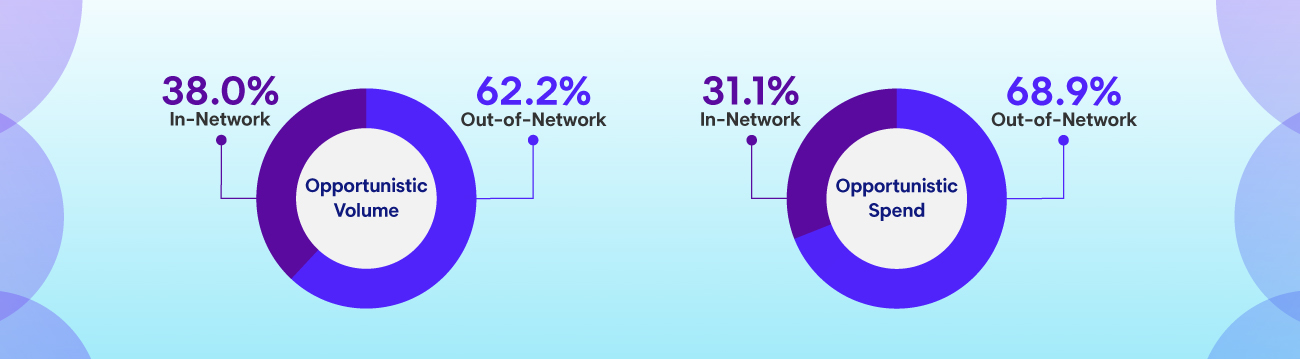
InsightOpportunistic products represent a small fraction of volume but a massive cost driver—just 11.3% of out-of-network (OON) scripts account for 45.5% of out-of-network costs, with nearly 69% of all opportunistic spend flowing through OON channels.
Overall Opportunistic Trends
Opportunistic Product Share of Total Prescriptions and Spend
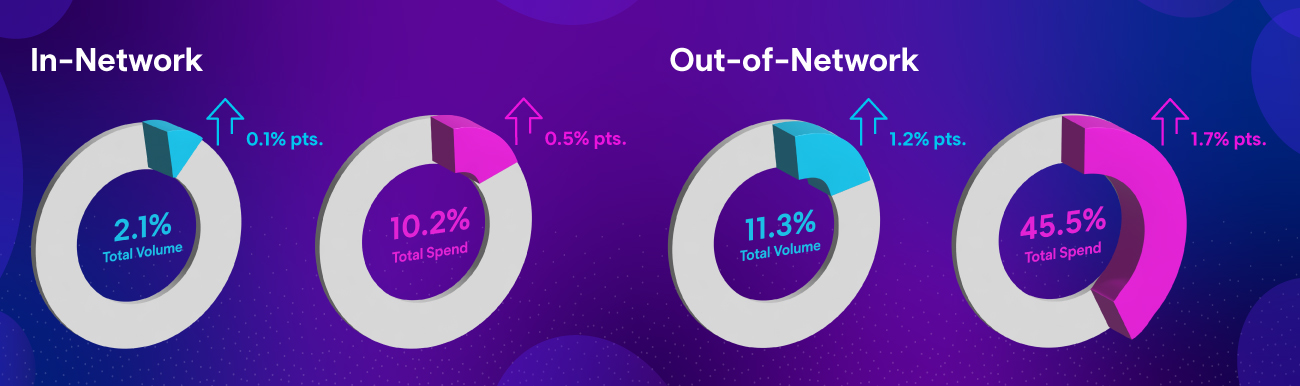
InsightOpportunistic product share is trending upward across both networks, with OON spend climbing 1.7 percentage points to now represent nearly half of all of out-of-network costs.
Abusive Pricing & Utilization:
Drug Category Breakdown by Network
To better understand where opportunistic products are driving costs, the following data compares utilization and spend by category across in-network and out-of-network channels. While opportunistic products appear across both network types, the distribution is far from equal—out-of-network channels account for 62.0% of opportunistic volume and 68.9% of total opportunistic spend. The category-level breakdown that follows highlights where these costs are concentrated within each channel and underscores the importance of comprehensive, cross-channel visibility in identifying and managing these cost drivers.
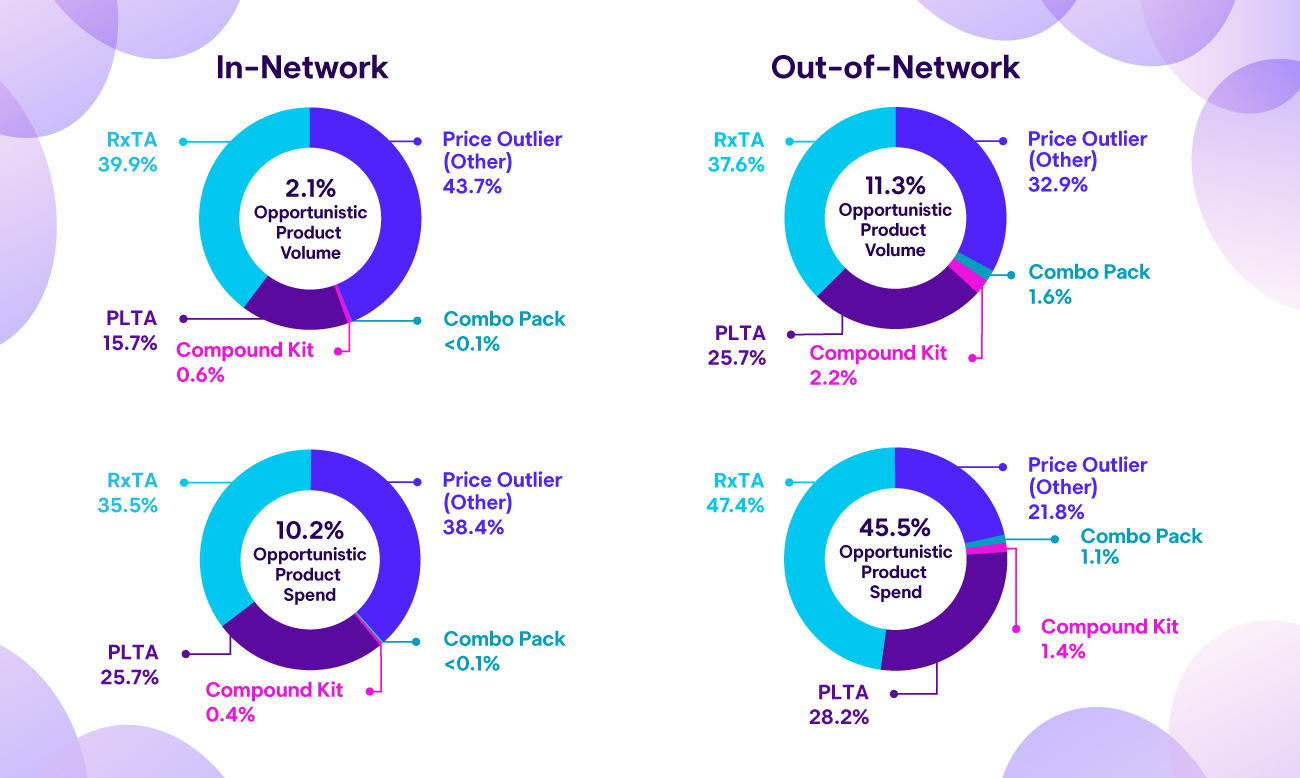
InsightRxTAs and PLTAs dominate opportunistic spend in both channels, while price outliers and topicals shift in share across networks—underscoring the need for cross-channel visibility to manage these cost drivers.
Prescription Topical Analgesics (RxTA)
This category and the data below narrows the focus within topical trends to only those prescription topical analgesics identified on our proprietary list of opportunistically or abusively priced products. These are a subset of high-cost RxTAs that command premium pricing disproportionate to their clinical value when compared to standard alternatives (examples include topical lidocaine and certain diclofenac products [Solaraze®]). While RxTAs that fall within our definition of opportunistic products represent just 16.8% of total topical analgesic volume, they account for 61.6% of total topical analgesic cost across all networks—underscoring the outsized financial impact of this subset on overall topical spend.
RxTAs represented a larger proportion of both overall and topical category costs due mainly to a change in drug mix with prescribing shifts toward more expensive cost per script lidocaine and diclofenac topical products in 2025.
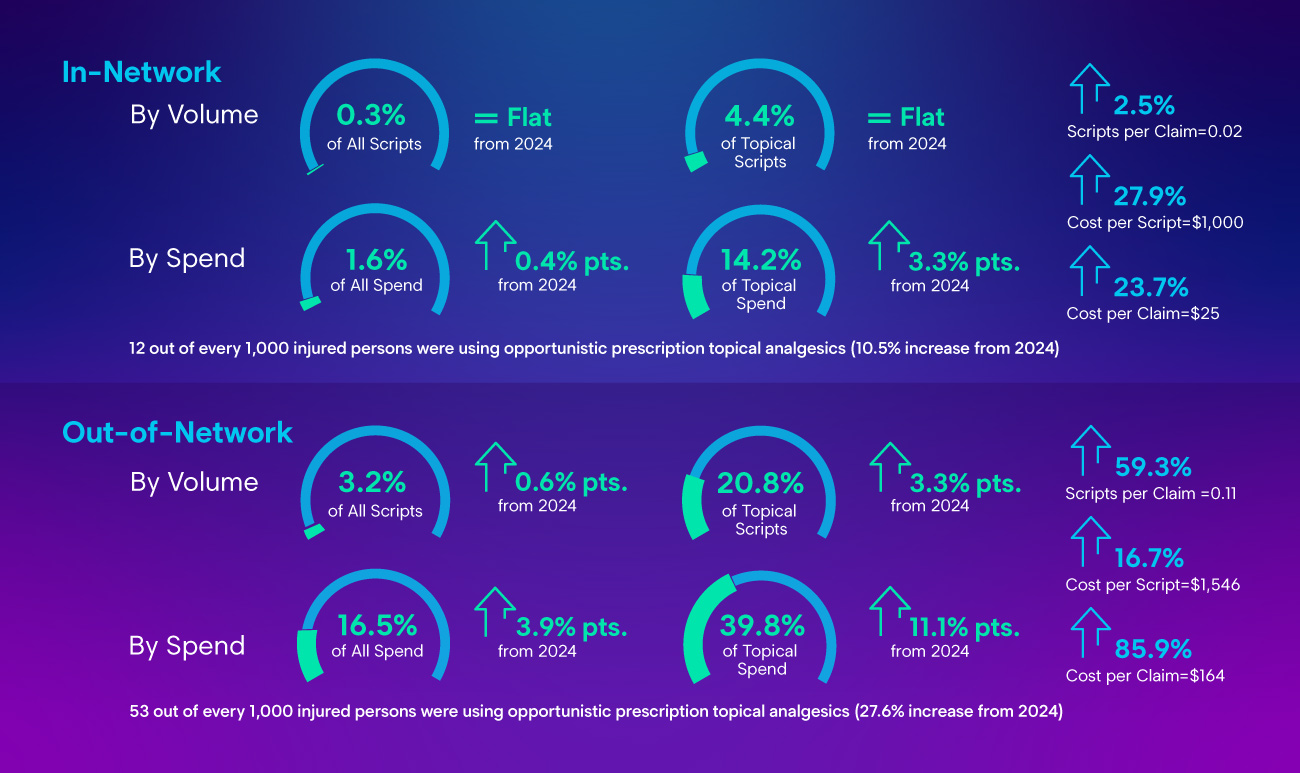
InsightOpportunistic RxTAs are surging—OON cost per claim jumped 85.9% and now represents nearly 40% of all topical spend, despite making up just 16.8% of total RxTA volume across networks.
Private-Label Topical Analgesics (PLTA)
PLTAs represent a distinct category within the topical therapeutic class consisting of high-dollar, branded products that are not recommended as first-line therapy and offer no greater clinical benefit than more cost-effective over-the-counter (OTC) alternatives that contain the same or similar active ingredients.
PLTAs create significant challenges across multiple channels. When marketed directly to physicians' offices for dispensing, they result in paper billing and out-of-network concerns that complicate cost management. Increasingly, these products are also appearing on retail pharmacy shelves—some dispensed out-of-network and bypassing traditional safety and clinical controls, while others process in-network, particularly in states like New York where manufacturers are developing high-cost versions of products that fall on covered state formularies. Examples include Lidopro®, Fortex® and New Terocin.
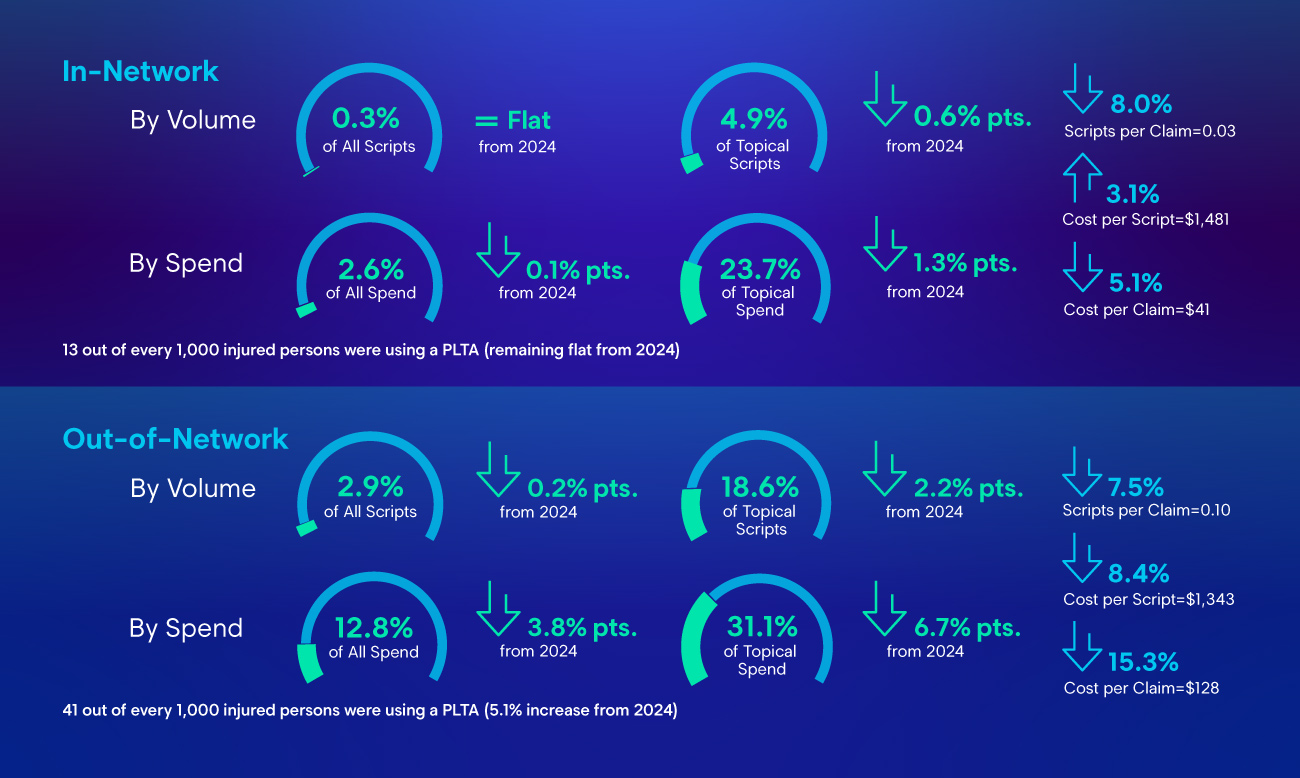
InsightPLTA volume and spend are declining across both networks, but these high-dollar branded products still command over $1,300 per script—despite offering no greater clinical benefit than cost-effective OTC alternatives.
PLTAs are processed almost exclusively out-of-network, with 72.8% of scripts billed through retrospectively managed channels, representing an average script cost of $1,343. While PLTA claim costs have decreased 12.3% across all networks, PLTAs continue to drive a disproportionate share of out-of-network pharmacy spend—representing 12.8% of out-of-netowork costs on just 2.9% of script volume. It remains essential to apply an integrated program with a view into pharmacy bill review activity to best address these opportunities for effective clinical and cost management across the total view of prescription activity. Our clients with automated prior authorization controls are achieving up to 33% reduction in annual out-of-network prescription spend through retrospective management of these cost-drivers.

InsightThe vast majority of PLTAs are billed through OON channels averaging $1,343 per script, but clients with automated prior authorization controls are achieving up to a 33% reduction in annual OON prescription spend.
Combo/Convenience Pack Trends
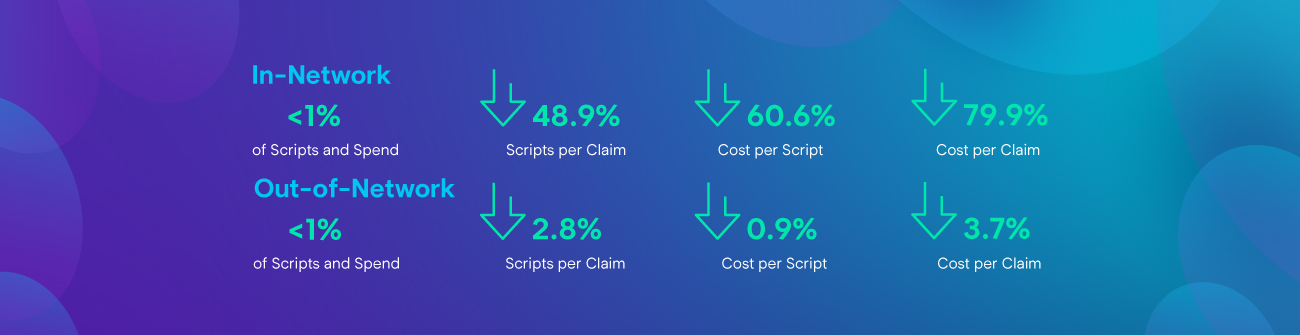
Combo packs consist of multiple, commercially-available products that are conveniently pre-packaged together for a common therapeutic purpose. Often the individual components are available separately at a much lower cost. Examples include BetalidoTM and DyuralTM.
Compound Kit Trends
Compound kits contain two or more pre-measured drug ingredients that must be combined immediately prior to use based on a prescription and are sold together as one product. Often the individual components are available separately, or in a different formulation, at a much lower cost. Examples include MarlidoTM and EnovaRXTM-Ibuprofen.
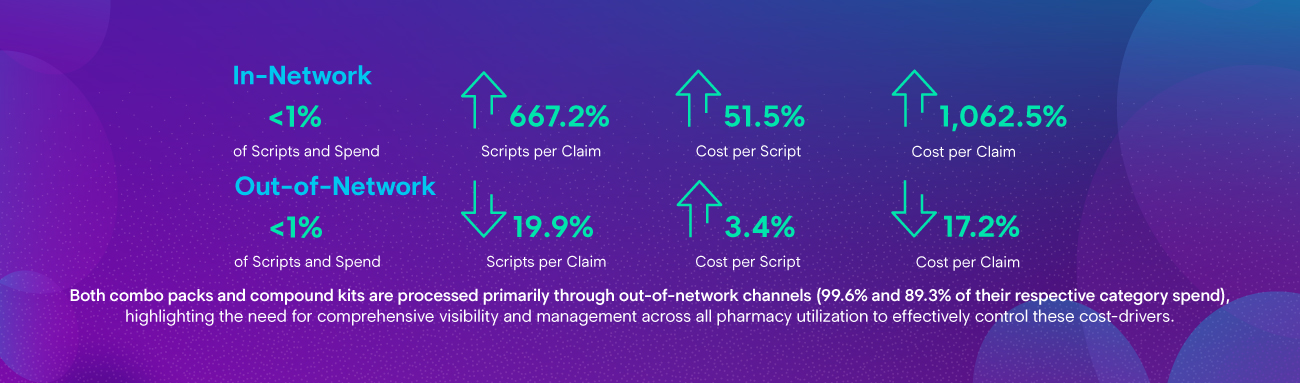
InsightThough both categories represent less than 1% of volume and spend, compound kits surged 1,062.5% in cost per claim in-network—and nearly all combo pack and compound kit spend flows through OON channels where visibility is critical.
Key Takeaways
- Opportunistic products continue to drive outsized costs relative to volume. At just 11.3% of out-of-network scripts, these products account for 45.5% of out-of-network spend—up 1.7 percentage points from the prior year—demonstrating that the problem is growing, not stabilizing.
- The cost burden is concentrated in out-of-network channels. Nearly 69% of all opportunistic product spend flows through out-of-network channels, where traditional clinical controls and network pricing protections are limited or absent.
- RxTAs are an accelerating cost driver. Opportunistic prescription topical analgesics saw significant year-over-year increases in out-of-network utilization and cost, driven by prescribing shifts toward higher-cost lidocaine and diclofenac products. Out-of-network RxTA cost per claim rose 85.9%, signaling an urgent need for targeted intervention.
- PLTAs remain a persistent challenge despite modest declines. While PLTA costs have decreased year-over-year, they continue to represent a disproportionate share of out-of-network spend—12.8% of out-of-network costs on just 2.9% of script volume—and are increasingly appearing across both physician dispensing and retail pharmacy channels.
- Combo packs and compound kits are processed almost exclusively out-of-network. With 99.6% and 89.3% of their respective category spend occurring outside of network controls, these products remain largely invisible without integrated pharmacy management that includes medical bill review.
- Visibility across all channels is critical. The data reinforces that relying solely on in-network pharmacy benefit management (PBM) reporting provides an incomplete picture. A comprehensive view that include out-of-network and paper-billed prescriptions is essential to identifying and managing these cost drivers effectively.

Recommendations to Optimize Your Pharmacy Program
- Implement integrated pharmacy management across all channels. Ensure your program captures both in-network PBM activity and out-of-network/paper-billed prescriptions to gain full visibility into opportunistic product utilization and spend.
- Deploy automated prior authorization controls for out-of-network prescriptions. Clients leveraging retrospective prior authorization are achieving up to 33% reduction in annual out-of-network prescription spend—a proven strategy for managing high-cost, clinically questionable products.
- Target high-cost topical categories with clinical review protocols. Establish formulary-based and therapeutic substitution guidelines that steer prescribing away from opportunistically priced RxTAs and PLTAs toward clinically equivalent, cost-effective alternatives.
- Monitor physician dispensing activity in permissive jurisdictions. States with broad physician dispensing laws are primary channels for PLTA and opportunistic product distribution—proactive monitoring and education in these jurisdictions can reduce unnecessary out-of-network spend.
- Flag and review mail-order pharmacy billing patterns. Out-of-network mail-order services—particularly those marketing directly to injured workers or personal injury claimants—should be monitored for abusive billing practices and pricing anomalies.
- Leverage data analytics to identify emerging cost outliers. Regularly update and review proprietary opportunistic product lists to stay ahead of new market entrants and shifting prescribing patterns that may signal emerging cost threats.
- Educate prescribers and claims professionals. Promote awareness of opportunistic product trends among treating physicians and adjusters to support clinically appropriate prescribing decisions and timely identification of cost outliers at the claim level.

Want the full view of workers’ comp and auto pharmacy trends?
Explore Enlyte’s 2026 Drug Trends Analysis series for insights on retail and mail-order prescriptions, opioids, topicals, specialty medications, network patterns, and more.
Methodology Statement
This information is based upon clients where both in-network (retail and mail-order) and out-of-network (OON) Bill Review prescriptions were available for analysis. Including this client base allows for the most accurate representation of overall trend experience.