


Nikki Wilson, Pharm.D., MBA
Senior Director, Clinical Pharmacy Services
Opioid Trends
A Continued Shift in the Right Direction
Opioid prescribing continues its multi-year decline—a trend that reflects the collective impact of evidence-based clinical controls, regulatory reform, and industry-wide awareness.
This section of our drug trends analysis takes a closer look at the current state of opioid utilization and spend across in-network and out-of-network channels, examining category-level trends, prescribing patterns by claim maturity and jurisdiction, and key clinical risk markers. While the overall trajectory is favorable, the data also reveals areas of concern—including rising out-of-network costs and sustained-release formulations driving a disproportionate share of spend—that warrant continued vigilance and targeted intervention.
Key Trends: Utilization and Cost Trend Changes Across All Networks
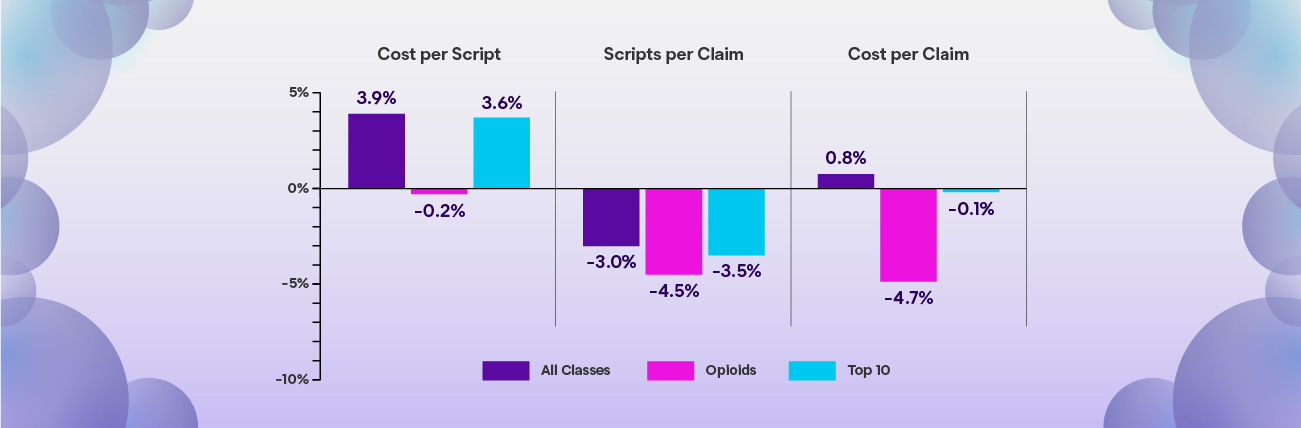
Overall, pharmacy cost per claim increased 0.8% from 2024 to 2025, driven by a 3.9% rise in cost per script. Opioids experienced a downward trend across all categories with a 4.7% reduction in cost per claim primarily attributed to decreased utilization.
Insights
Opioid claim costs fell 4.7% overall, yet out-of-network channels drive an outsized share of spend, signaling the need for continued oversight.
Overall Opioid Trends
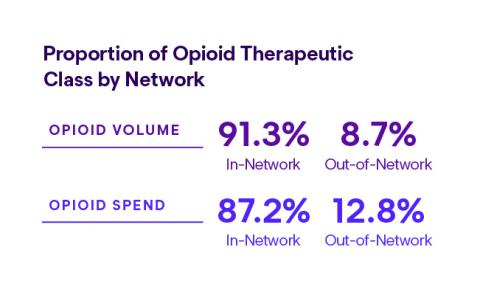
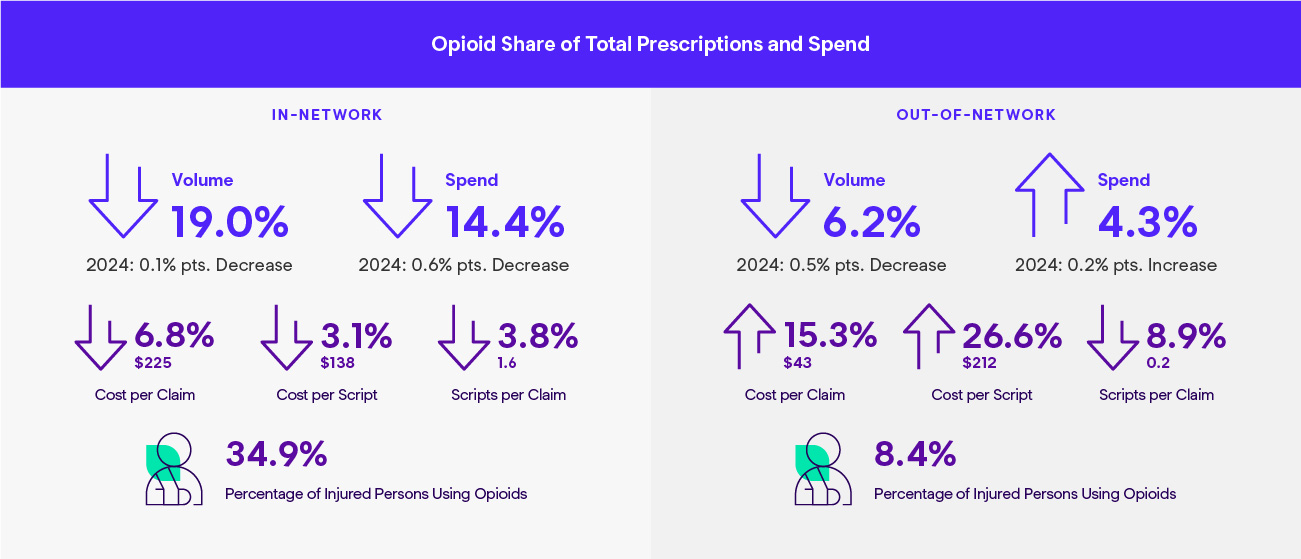
Opioids continue to be a significant area of focus in pain management spaces and injury claims. Unlike topical medications, which see a substantial share of activity flow through out-of-network (OON) channels, the vast majority of opioid prescriptions are filled in-network—with 91.3% of opioid volume and 87.2% of opioid spend processed through prospectively managed network channels. The proportion of opioid scripts and spend dropped from 2024, with the exception of a slight uptick in OON opioid spend even as utilization declined. Even while the category continues to decline as a percentage of total script volume and spend, it remains essential to promote evidence-based risk management strategies—particularly in the OON space, where rising cost per script and cost per claim suggest that pricing pressures persist despite lower volume.
Insights
In-network opioid costs are trending down across the board, but out-of-network cost per script surged 26.6%—proving that pricing pressure persists even as utilization falls.
Opioid Drug Category Breakdown by Network
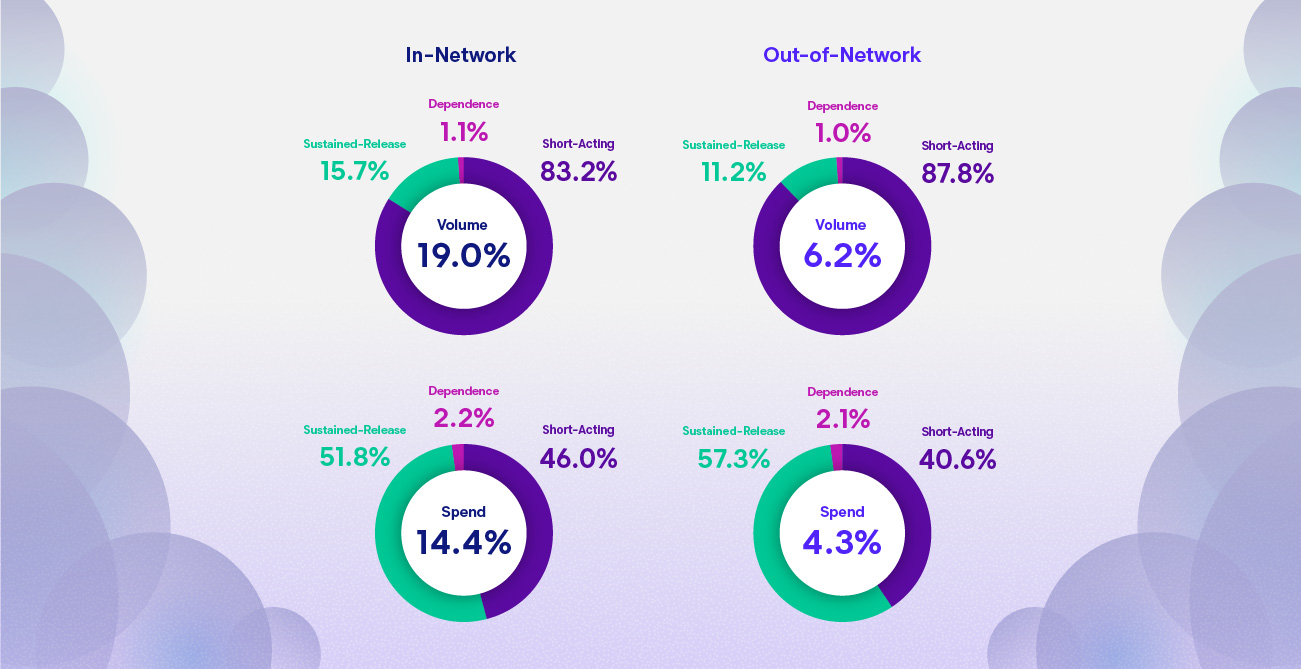
The following data examines opioid utilization and spend by subcategory—short-acting, sustained-release, and dependence medications—across in-network and out-of-network channels. While short-acting opioids dominate volume in both channels, sustained-release formulations drive a disproportionate share of cost—accounting for over half of opioid spend in both network types despite representing a fraction of script volume. This is noteworthy given that current evidence-based guidelines recommend immediate-release opioids over extended-release and long-acting formulations when initiating opioid therapy. The sustained-release cost concentration—particularly in mature claims—points to opportunities to better align prescribing practices with guideline recommendations through clinical interventions such as step therapy, prior authorization, and duration-of-use monitoring. The network-level comparison also reveals differences in prescribing mix that may reflect variations in claim maturity, treatment setting, and the degree to which clinical controls are applied across channels.
Insights
Sustained-release opioids account for over half of opioid spend across both networks despite representing a fraction of volume—highlighting a key opportunity to align prescribing with evidence-based guidelines.
Top 5 Opioid Medications Ranked by Spend
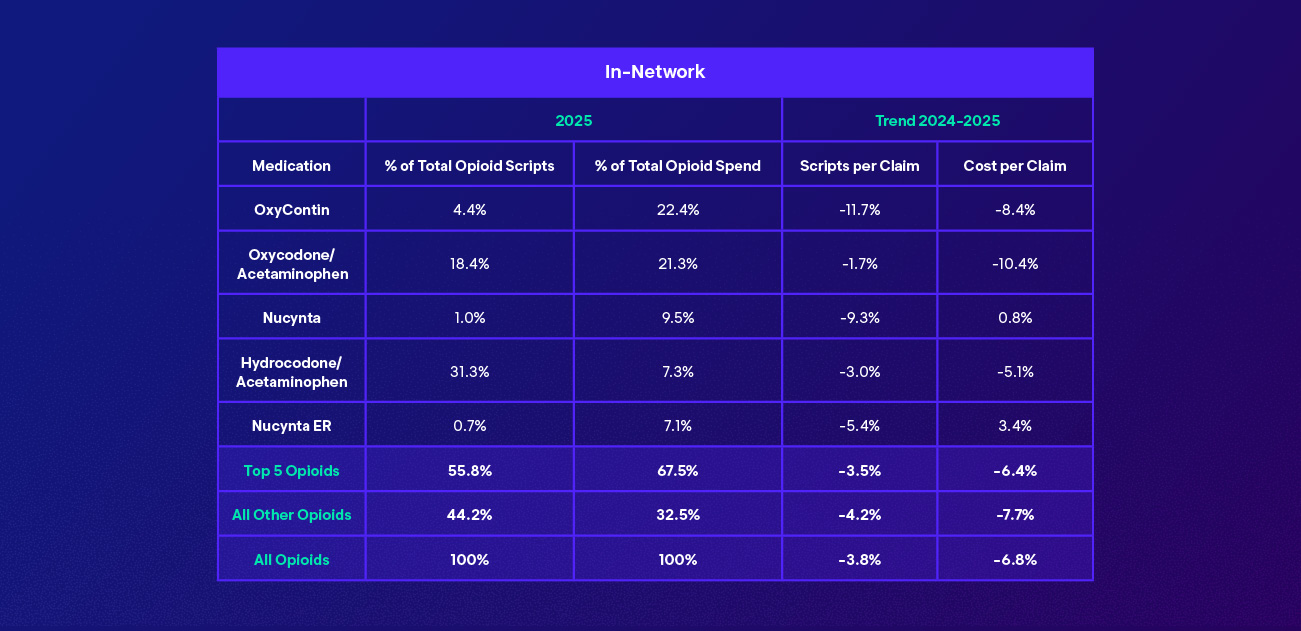
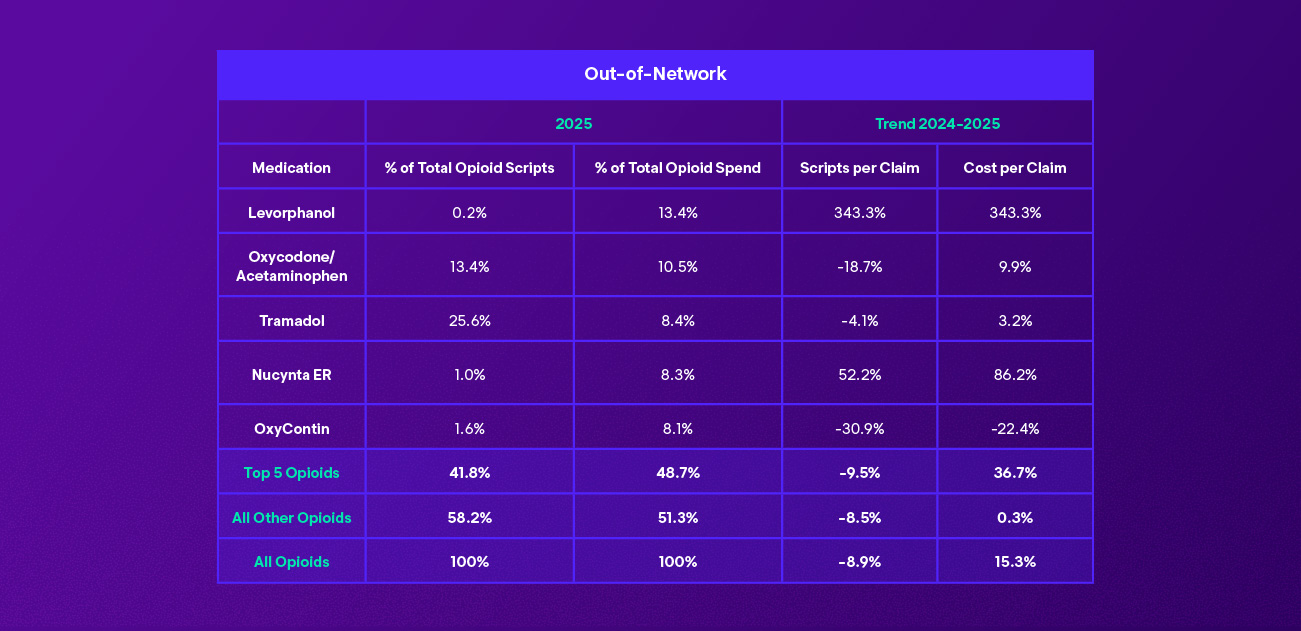
The following tables identify the five highest-cost opioid medications within each network channel, ranked by their share of total opioid spend. In-network, the top five products account for 67.5% of opioid costs on 55.8% of script volume, with favorable year-over-year declines in both scripts per claim and cost per claim—reflecting the continued effectiveness of clinical controls in managing opioid utilization and spend. Out-of-network, the top five represent a smaller share of opioid costs at 48.7% of spend on 41.8% of volume, with a few notable differences in product mix. Most striking is the position of levorphanol–a potent, long-acting opioid representing just 0.2% of OON opioid script volume yet commanding 13.4% of OON opioid spend, with a 343.3% increase in cost per claim year-over-year. Nucynta ER also saw significant growth OON, with cost per claim rising 86.2%.
While overall OON opioid utilization declined, cost per claim rose 15.3%—driven by high-cost products within the top five rather than the broader mix, as spending among opioids outside the top five remained relatively flat (+0.3%). This concentration of cost pressure around a small number of high-dollar products underscores the need for targeted clinical review of OON opioid prescribing.
Insights
A handful of high-cost opioids are driving outsized spend—most notably levorphanol, which represents just 0.2% of OON volume but commands 13.4% of OON opioid spend after a 343% cost surge.
Opioids and Age of Claim
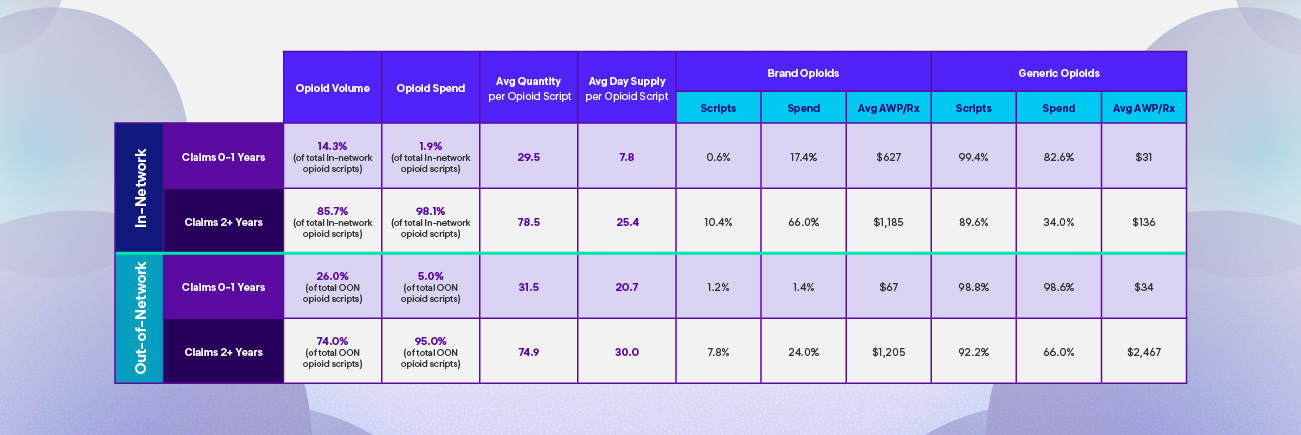
Understanding opioid utilization in the context of claim maturity is critical to identifying where clinical risk and cost exposure are concentrated. The data below segments opioid prescribing patterns by claims in their first year versus those aged two years or more across both network channels. As claims mature, opioid utilization patterns shift significantly—average quantities and day supplies increase, brand-name prescribing becomes more prevalent, and per-script costs rise substantially. In-network, claims aged two or more years account for 85.7% of opioid volume and 98.1% of opioid spend, with average day supply more than tripling compared to first-year claims. These patterns underscore the importance of early intervention and proactive clinical management in the acute phase of a claim to help prevent the transition to long-term, high-cost opioid use—and highlight the need for continued oversight and tapering strategies on mature claims where sustained opioid therapy may no longer align with evidence-based treatment goals.
Insights
Mature claims (2+ years) drive the vast majority of opioid volume and spend—accounting for 98.1% of in-network opioid costs—reinforcing the need for early intervention and ongoing tapering strategies.
Morphine Equivalent Dose Trends
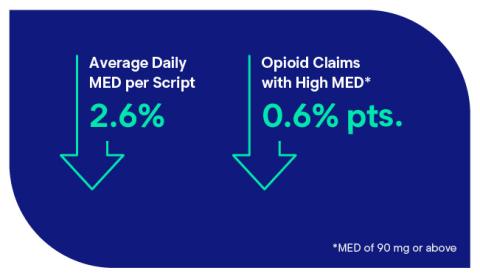
Favorable trends continue in important opioid clinical and risk markers such as morphine equivalent dose (MED), duration of use, and access to guideline-supported measures including medication-assisted treatment (MAT) and overdose rescue medication (naloxone). Both average daily MED per script (down 2.6%) and the percentage of opioid claims with high MED levels of 90mg or above (down 0.6 percentage points) continued to decline in 2025—extending a consistent downward trend now spanning nine consecutive years.
While MED is just one of several important clinical markers, it is a meaningful one—these sustained reductions signal that prescribing practices are increasingly aligning with evidence-based dosing guidelines, reducing both the clinical risk of opioid-related harm and the likelihood of long-term dependence among injured persons.
Medication-Assisted Treatment and Naloxone
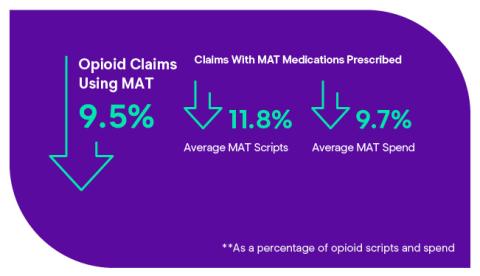
Opioid claims using MAT dropped 9.5%, and of those claims with MAT medications prescribed, average MAT scripts and spend decreased 11.8% and 9.7%, respectfully. Buprenorphine and methadone (commonly-prescribed to treat opioid use disorder) scripts decreased 0.4% points to 2.1% and associated spend fell in kind by 0.3% points to 2.4% in 2025.** 9.1% of opioid claims with MED greater than 50 received naloxone (opioid overdose reversal agent), which was slightly improved compared to the year prior (8.9%).
Insights
Average daily MED and high-dose opioid claims have now declined for nine consecutive years, signaling that clinical controls and prescribing practices are steadily aligning with evidence-based dosing guidelines.
*MED of 90 mg or above
**As a percentage of opioid scripts and spend
Opioid Utilization Rankings Among the Top 5 States by Prescription Volume
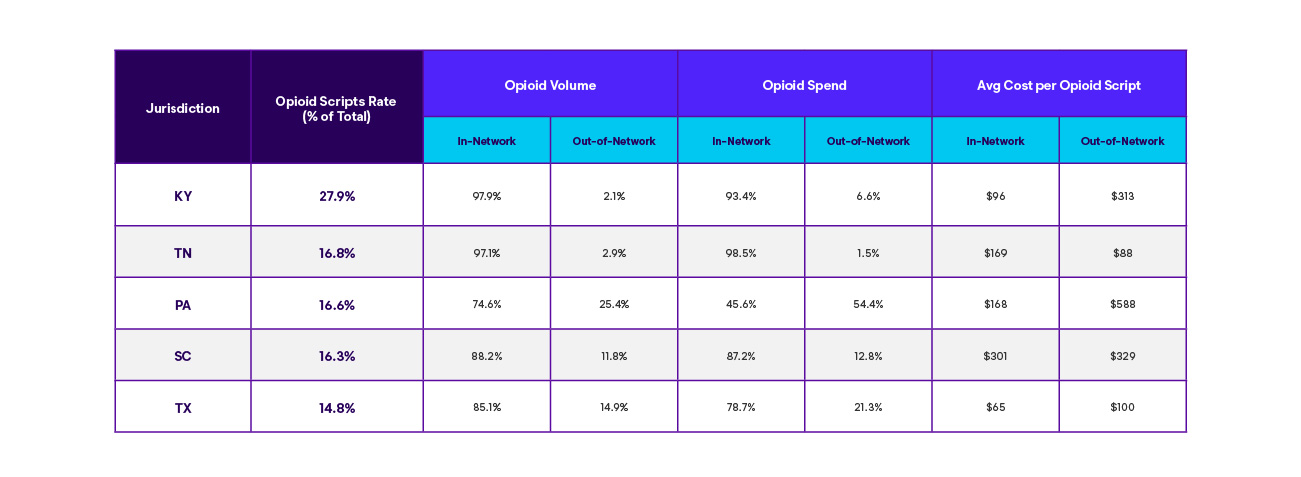
Among the highest-volume states in the book of business, the top five by opioid prescription rate—measured as opioid scripts as a percentage of total scripts—reveal key prescribing trends across jurisdictions. These jurisdictional differences highlight the influence of state-level regulatory environments, network access, and prescribing culture on opioid utilization patterns—and underscore the importance of tailoring clinical management strategies to the specific dynamics of each state.
Across all jurisdictions, several states exceeded 20% in OON opioid activity relative to total opioid metrics. By opioid script volume, the leading states were PA, AZ, IL, and OK. By opioid spend, the list expanded to include PA, AZ, OK, DC, NH, TX, and IL—suggesting that OON opioid costs are more widespread than volume alone indicates.
Insights
Opioid prescribing patterns vary widely by state, and OON cost exposure is more widespread than volume alone suggests—with states like PA directing over half of opioid spend through out-of-network channels.
High-Dose Opioid Prescribing Trends by Jurisdiction
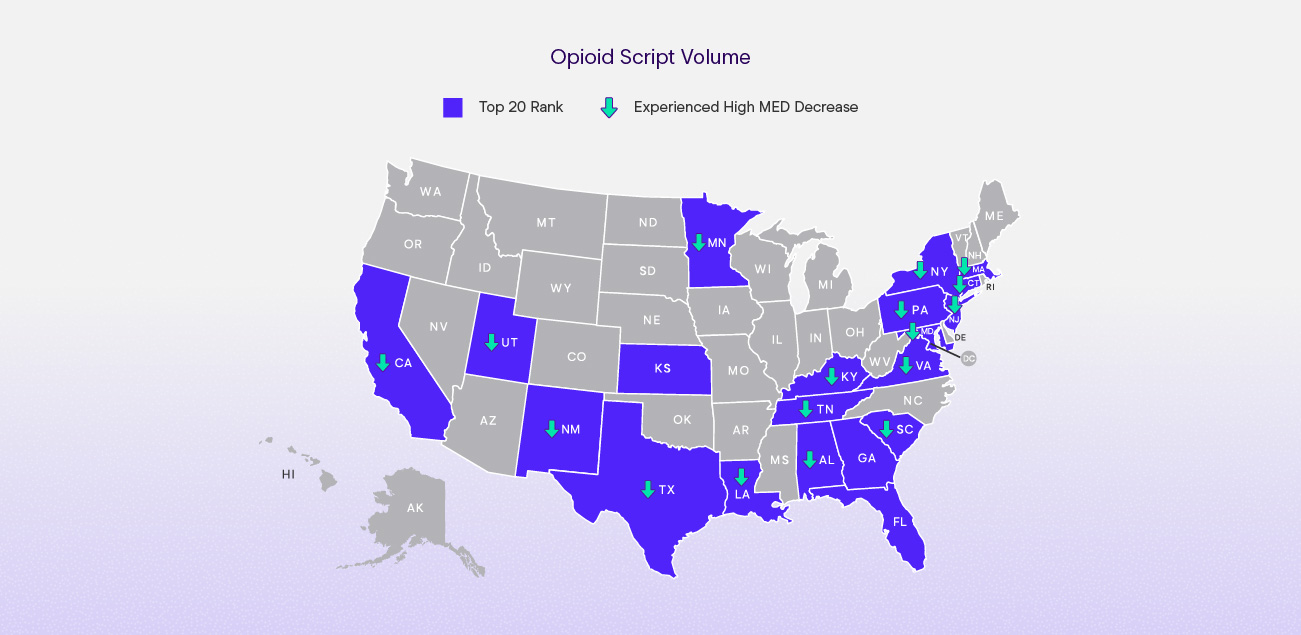
The majority of the top 20 states ranked by opioid script volume saw decreases in high MED prescriptions in 2025, with 17 of 20 jurisdictions trending favorably. Among those, New Mexico, New York, Louisiana, and Minnesota led the way with reductions exceeding 25% year-over-year. Encouragingly, the progress extends beyond volume alone—several states also saw meaningful reductions in average MED among high-dose scripts, suggesting that not only are fewer high MED prescriptions being written, but the doses among those that remain are coming down. Of the three states that experienced increases, two saw significant jumps in high MED scripts driven not by a shift in prescribing intensity, but rather by substantial growth in their overall opioid prescription base—indicating volume-driven rather than dosing-driven increases. A few jurisdictions (8 of the top 20), however, showed a pattern worth monitoring: while high MED script counts declined, the average MED among remaining high-dose prescriptions increased—potentially signaling that while lower-risk patients are being successfully managed, the most complex, highest-dose cases are persisting. New Jersey, despite an overall decline, continues to lead all jurisdictions in both high MED script count and average dosing intensity, representing an ongoing opportunity for targeted clinical intervention.
Insights
17 of 20 top states saw high-dose opioid declines, but a concerning pattern emerged in eight jurisdictions where the dosing levels of remaining high-dose scripts are climbing even as counts fall.
Key Takeaways
- Opioid utilization continues to decline but cost pressures are shifting. Overall opioid cost per claim fell 4.7% across all networks, driven by reduced utilization. However, out-of-network cost per script rose 26.6% and cost per claim increased 15.3%—indicating that while fewer opioids are being prescribed, those that are dispensed outside of network controls are becoming significantly more expensive.
- Sustained-release opioids drive a disproportionate share of spend. Despite representing a minority of script volume, sustained-release formulations account for over half of opioid spend in both network channels.
- Claim maturity is a key predictor of opioid cost and clinical risk. Claims aged two or more years account for the vast majority of opioid volume and spend, with significantly higher quantities, day supplies, and brand-name utilization compared to first-year claims. This concentration underscores the critical importance of early clinical intervention.
- MED trends remain favorable for the ninth consecutive year. Both average daily MED per script and the percentage of claims with high MED levels (≥90mg) continued to decline—a meaningful indicator that prescribing practices are increasingly aligned with evidence-based dosing guidelines.
- A small number of high-cost products are driving out-of-network opioid spend increases. The OON top five opioids by spend saw cost per claim rise 36.7%, while spending among all other OON opioids remained nearly flat—indicating that targeted intervention on specific high-dollar products offers the clearest path to managing rising out-of-network opioid costs.
- Jurisdictional variation remains significant. Opioid prescription rates, network distribution, and cost per script vary widely across states, with some jurisdictions showing outsized out-of-network opioid activity that warrants state-specific management strategies.
- MAT utilization declined. Opioid claims using medication-assisted treatment dropped 9.5%, with associated scripts and spend also decreasing—a trend worth monitoring to ensure injured workers with opioid use disorder continue to have access to evidence-based treatment.

Recommendations to Optimize Your Pharmacy Program
- Prioritize early clinical intervention on new claims. Implement proactive utilization management controls—including quantity limits, duration-of-use monitoring, and prescriber outreach—within the first year of a claim to reduce the likelihood of long-term, high-cost opioid use.
- Review sustained-release opioid prescribing for clinical appropriateness. Ensure that the use of extended-release and long-acting formulations is supported by clinical documentation and aligns with evidence-based prescribing recommendations. Where appropriate, leverage tools such as step therapy and prior authorization to promote guideline-consistent prescribing practices.
- Strengthen out-of-network opioid cost management. With out-of-network opioid costs rising despite declining volume, ensure your program includes retrospective clinical review and repricing capabilities for opioid prescriptions processed outside of network controls.
- Monitor and manage high-MED claims. Continue to leverage MED monitoring tools to identify and intervene on claims exceeding recommended dosage thresholds, supporting safe tapering strategies where clinically appropriate.
- Ensure access to medication-assisted treatment (MAT). Despite declining MAT utilization, it remains a critical evidence-based intervention for injured persons with opioid use disorder. Review program policies to ensure MAT access is not being inadvertently restricted.
- Promote naloxone co-prescribing for at-risk patients. With only 9.1% of opioid claims with MED above 50mg receiving naloxone, there is significant room to improve access to this life-saving overdose reversal agent in alignment with Centers for Disease Control and Prevention (CDC) recommendations.
- Tailor strategies by jurisdiction. Leverage state-level data to identify jurisdictions with elevated opioid prescription rates, high out-of-network activity, or above-average cost per script—and deploy targeted clinical and network management strategies accordingly.
- Maintain comprehensive cross-channel visibility. Ensure your pharmacy program captures opioid activity across all channels—in-network pharmacy benefit management (PBM), out-of-network pharmacy, and paper-billed medical submissions—to gain a complete picture of opioid utilization and identify cost and clinical risks that may otherwise go undetected.

Want the full view of workers’ comp and auto pharmacy trends?
Explore Enlyte’s 2026 Drug Trends Analysis series for insights on retail and mail-order prescriptions, opioids, topicals, specialty medications, network patterns, and more.
Methodology Statement
This information is based upon clients where both in-network (retail and mail-order) and out-of-network (OON) Bill Review prescriptions were available for analysis. Including this client base allows for the most accurate representation of overall trend experience.