


Nikki Wilson, Pharm.D., MBA
Senior Director, Clinical Pharmacy Services
Download the Snapshot
Bridging the Complete Prescription Picture
In-Network and Out-of-Network Insights
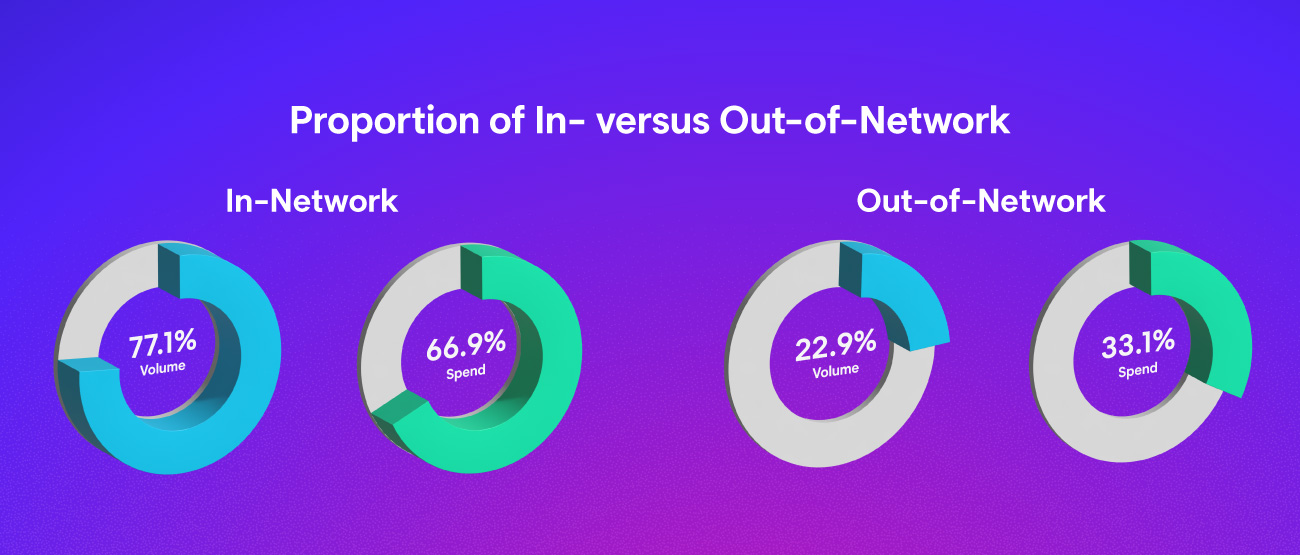
The 2025 Drug Trends analysis provides a comprehensive examination of prescription utilization across both in-network and out-of-network (OON) channels, including retail pharmacies, mail-order services, and paper-based medical bill submissions. This dual-lens approach captures the full prescription landscape that extends beyond traditional pharmacy benefit management reporting, revealing critical cost and utilization patterns across all jurisdictions. While in-network channels demonstrate the real-time effectiveness of integrated clinical controls and cost management strategies, out-of-network data, often representing acute treatment episodes captured through medical bill review, exposes significant cost management opportunities and pricing anomalies. Together, these perspectives illuminate where pharmacy dollars are spent, how prescriptions are managed, and where targeted interventions can drive the greatest impact on both clinical outcomes and costs.

Clinical Solutions That Drive Measurable Impact
The complexity of managing pharmacy benefits across workers' compensation and auto lines demands more than standard cost containment—it requires integrated clinical intelligence, evidence-based decision support and layered controls that address pricing anomalies, opportunistic dispensing and fragmented utilization across network channels.
Clients leveraging Enlyte's integrated pharmacy benefit management and bill review services who have opted into an evidence-based formulary and clinical and regulatory drug decision support capabilities are seeing measurable, sustained impact across their pharmacy spend:
Opportunistic Product Management
- Opportunistic product interventions accounted for 67% of all clinical decision support savings across just 33% of impacted scripts - demonstrating outsized value per intervention
- $915 average savings per opportunistic script - nearly 4x higher than non-opportunistic clinical interventions
- For clients leveraging auto-decision rules, nearly half (49%) of opportunistic product savings required zero claims examiner intervention - eliminating administrative burden while ensuring consistent, evidence-based adjudication
Out-of-Network Cost and Utilization Performance
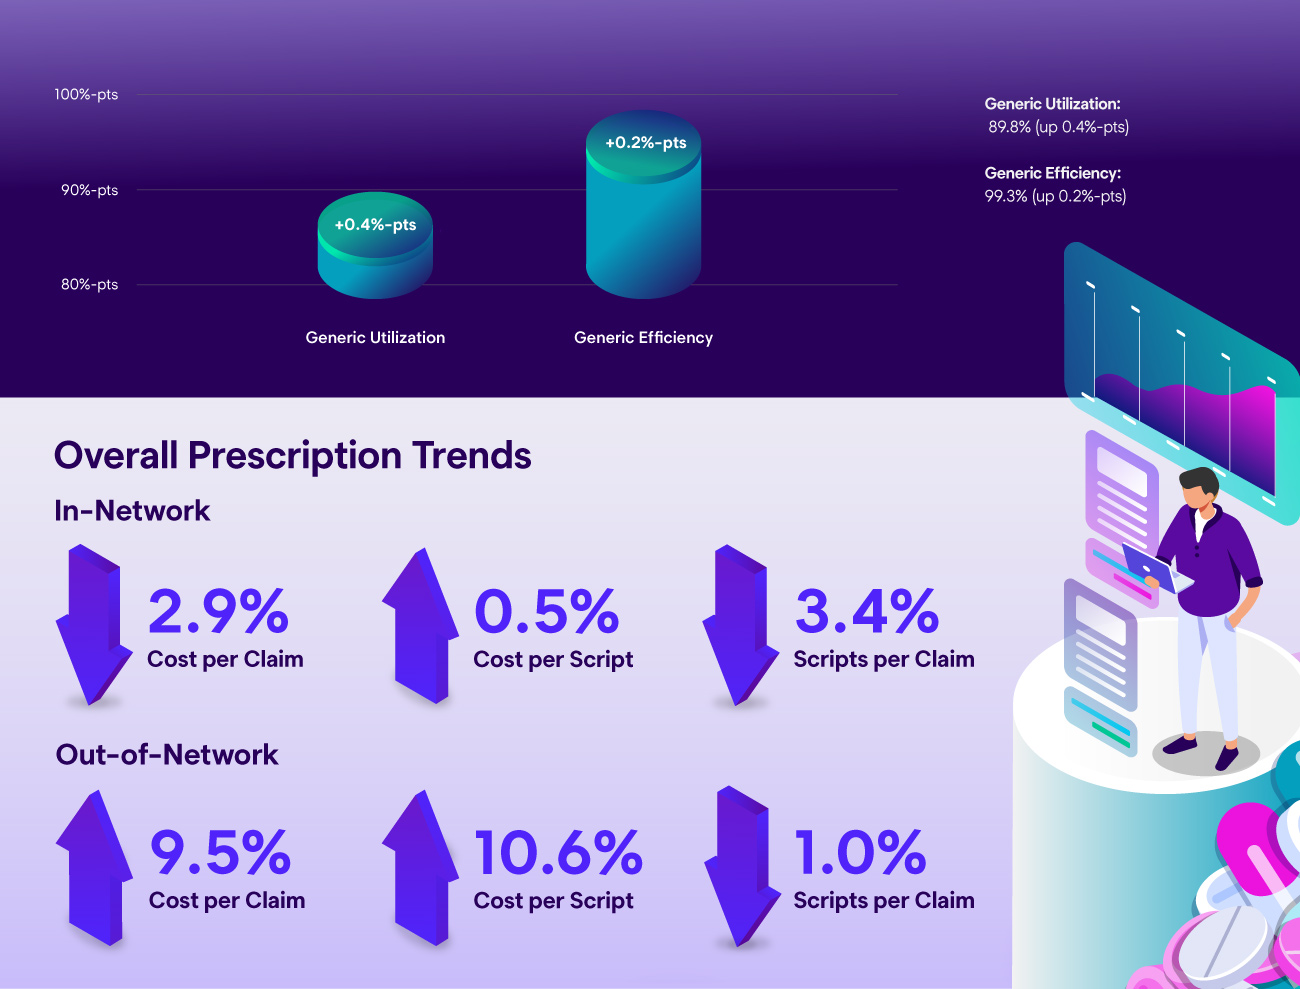
Beyond opportunistic products, clients utilizing these services demonstrated consistently lower costs across all scripts in both in-network and out-of-network settings. The most significant impact was observed in out-of-network in OON channels—where pricing is inherently highest, least standardized and most susceptible to inflated charges.
- ~25% lower cost per script compared to clients without integrated clinical controls
- 41% lower pharmacy cost per claim
- 25–36% fewer scripts per claim, reflecting tighter utilization management and greater visibility into out-of-network prescribing and dispensing behavior
What This Means
These results underscore a clear pattern: targeted clinical oversight, paired with automated decision support and integrated bill review, delivers compounding value — particularly in out-of-network environments. Clinical decision support capabilities delivered an 18.4% reduction in total pharmacy spend, with the out-of-network channel driving 58% of all savings despite representing a smaller share of total script volume. The trends and insights that follow illustrate why these controls matter and where the greatest opportunities remain.
Top Five States by Spend
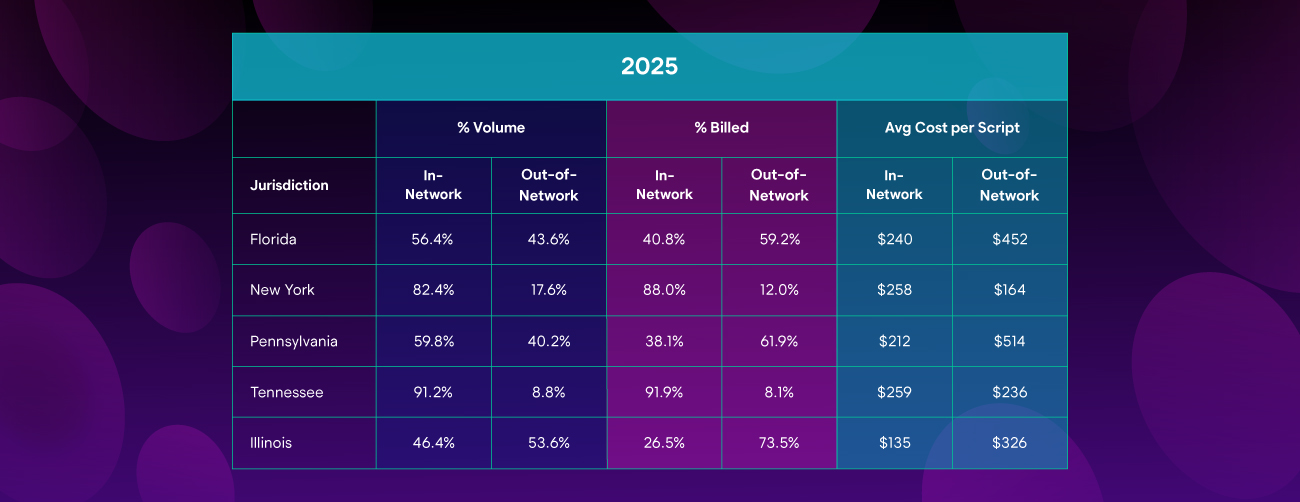
Florida, New York, Pennsylvania, Tennessee, and Illinois represent the jurisdictions with the highest billed amounts in the dataset, driven significantly by state-specific regulatory frameworks governing physician dispensing and pharmacy direction of care. Factors that directly influence network enforcement capabilities and prescription clinical and cost controls.
Combined In- and Out-of-Network Generic Trends
Top Therapeutic Classes by Spend
In-Network
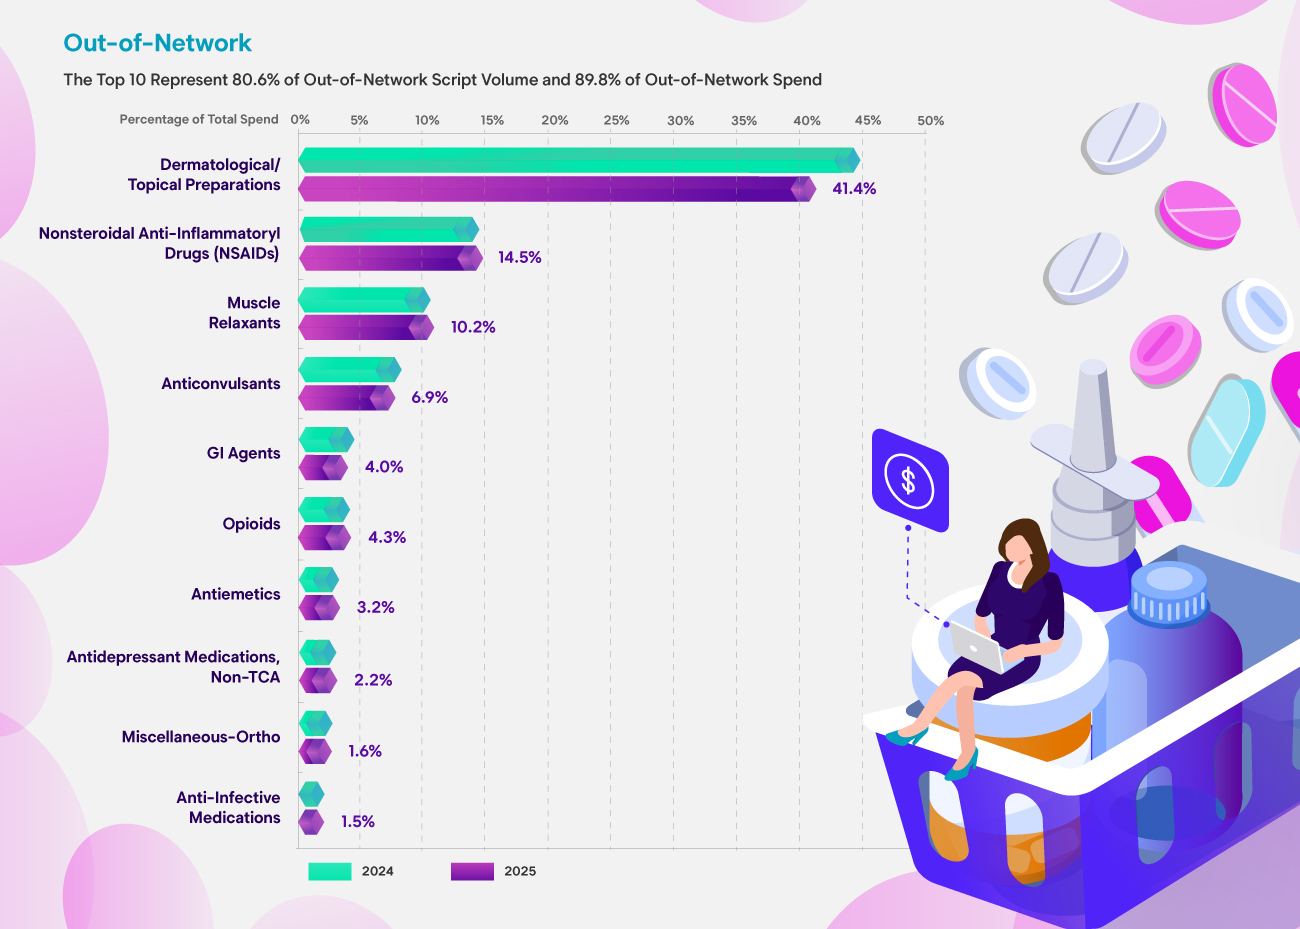
Out-of-Network
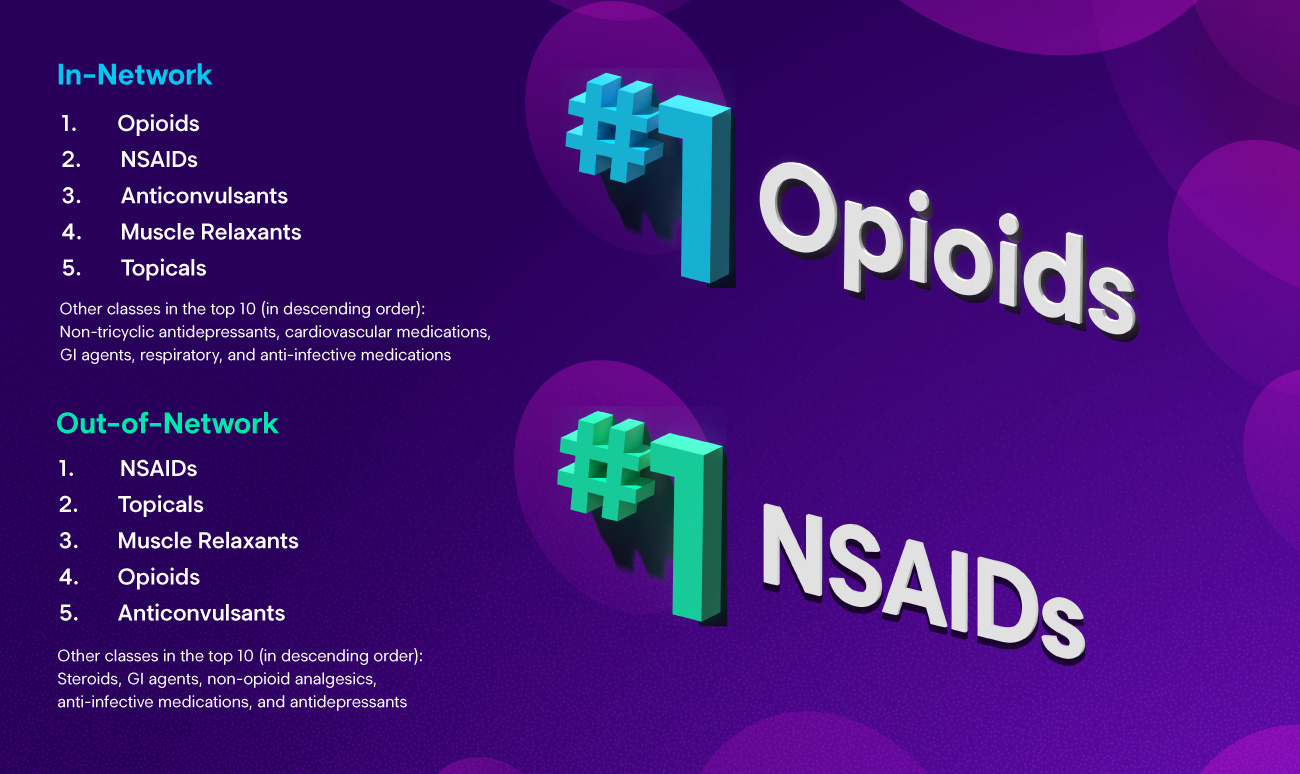
Top Therapeutic Classes by Script Count
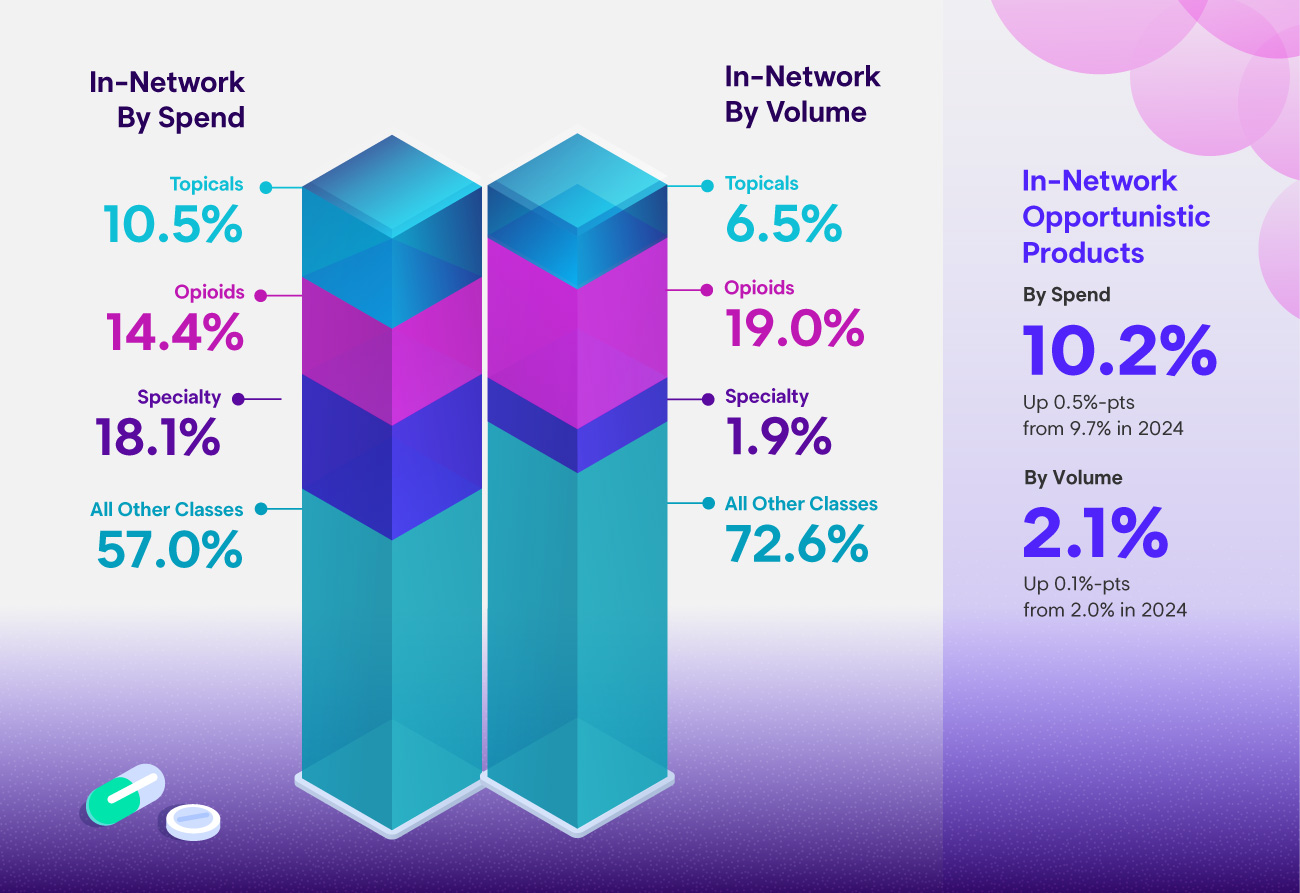
Trending Categories of Interest
In-Network
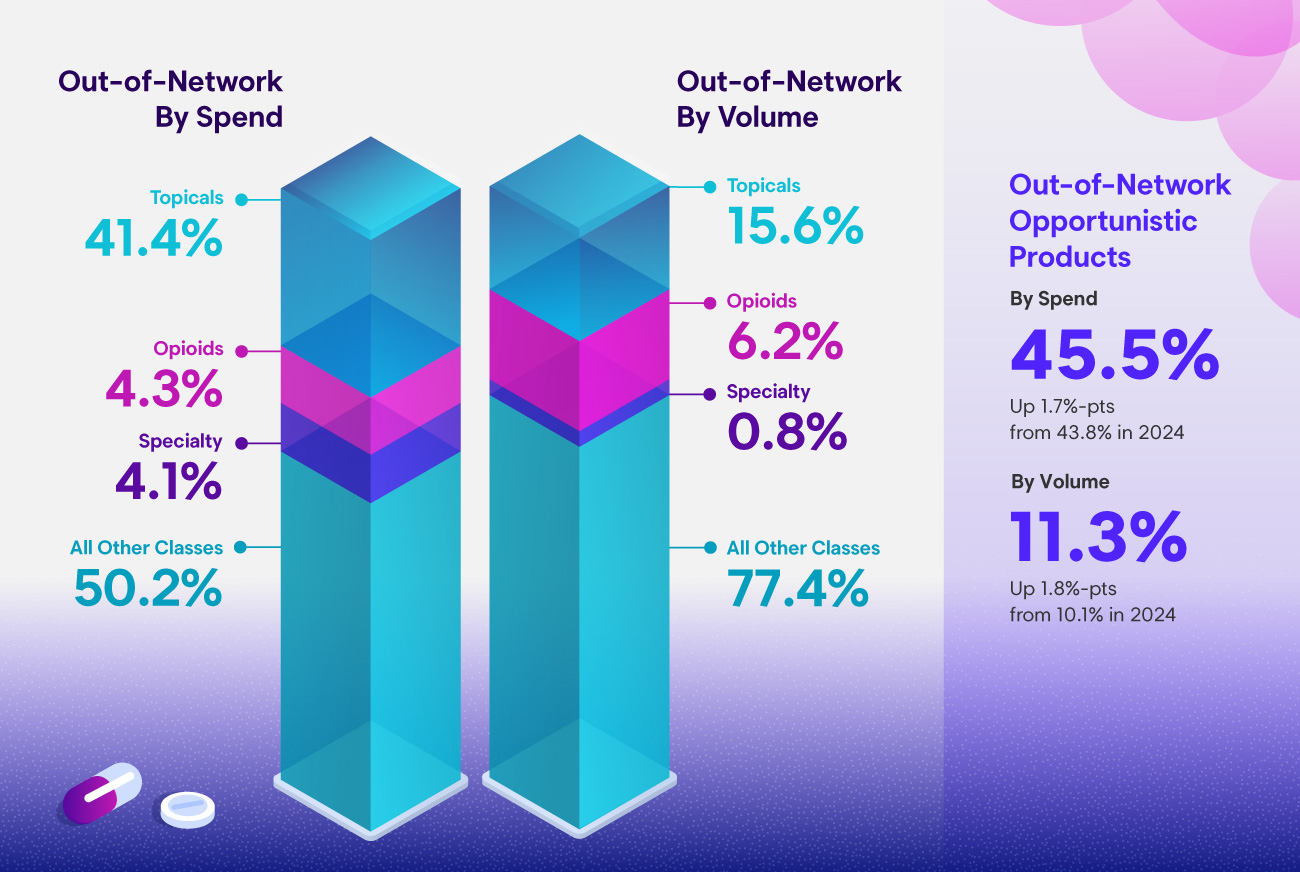
Trending Categories of Interest
Out-of-Network
Let's Recap
Of the top five states by spend, New York and Tennessee allow for pharmacy direction of care which is reflected in the relatively low proportion of script volume (17.6% and 8.8%, respectively) coming through out-of-network channels. States that have allowances in the regulations for physician dispensing tend to have higher out-of-network script volume and proportion of spend. New York presents a counterintuitive pattern: in-network prescriptions carry a higher average cost per script than out-of-network fills. While certain drugs are allowed on the state-mandated New York formulary, some prescribers and dispensers are systematically selecting high-cost, opportunistically-priced versions of those drugs. Without clear cost controls or enforcement mechanisms, this practice drives elevated in-network costs while bypassing prior authorization and clinical review.
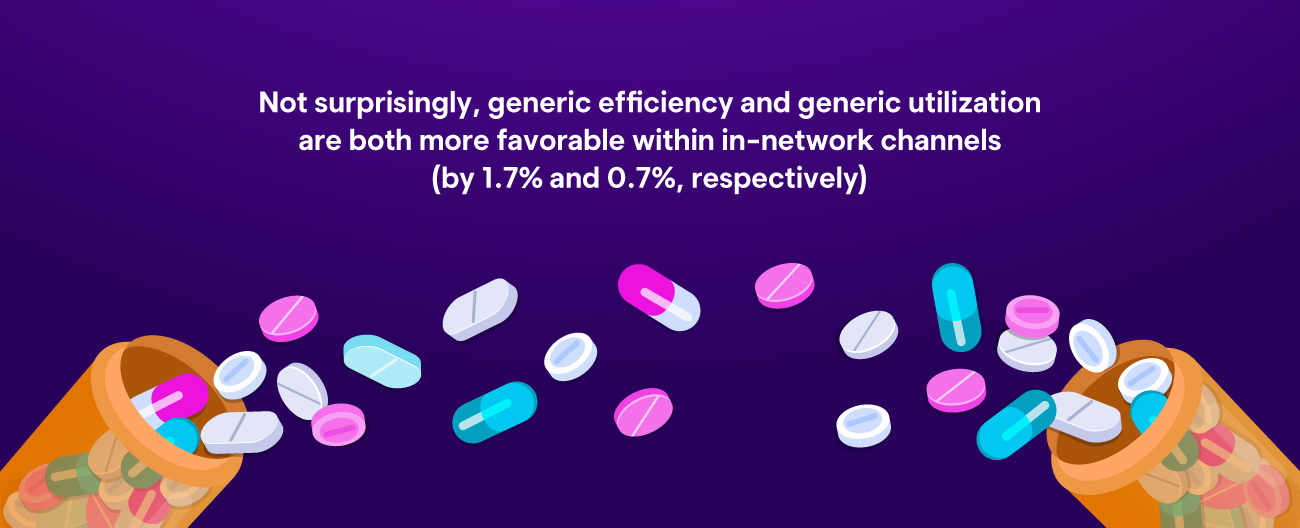
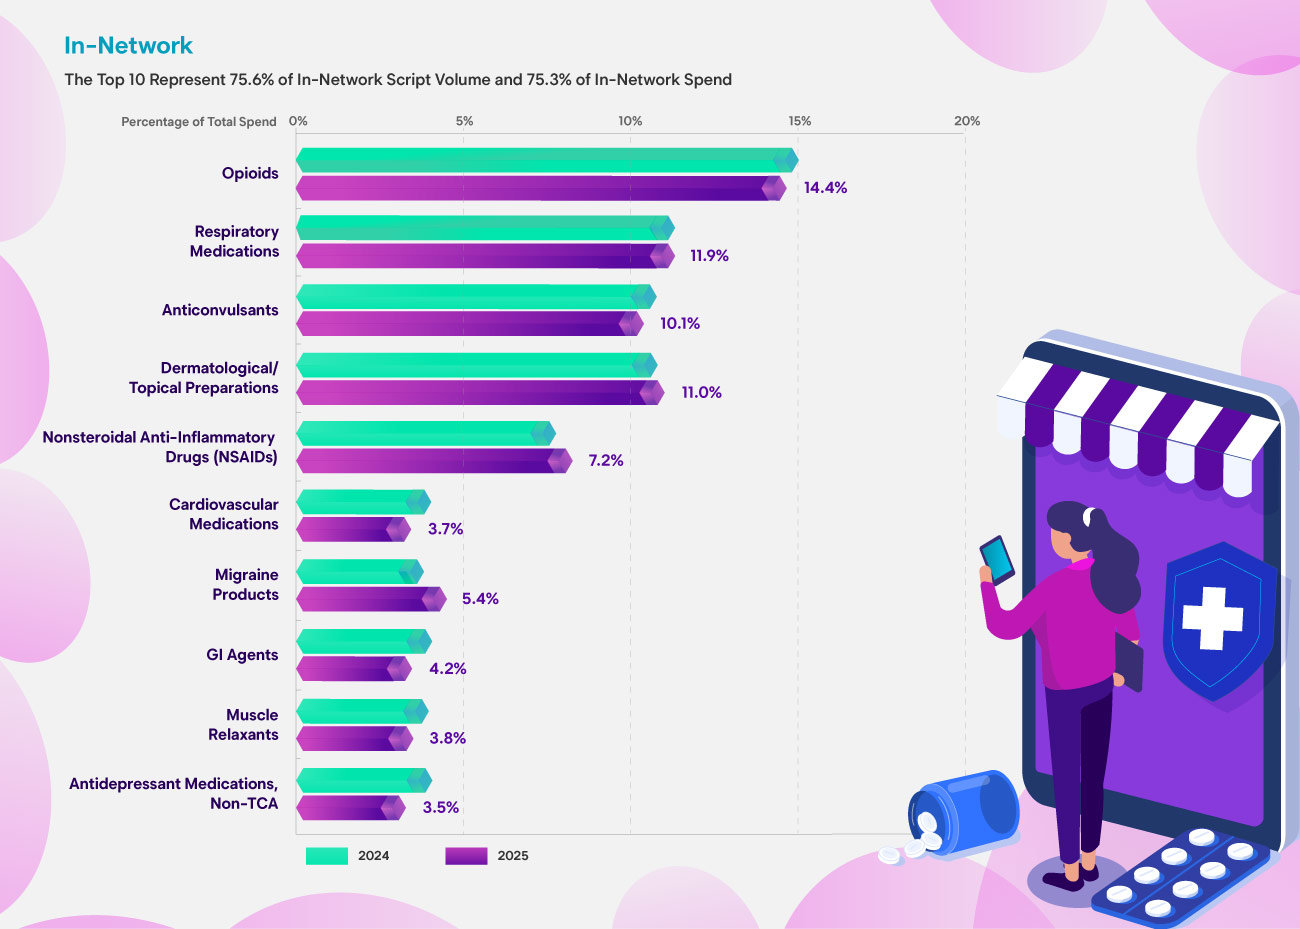
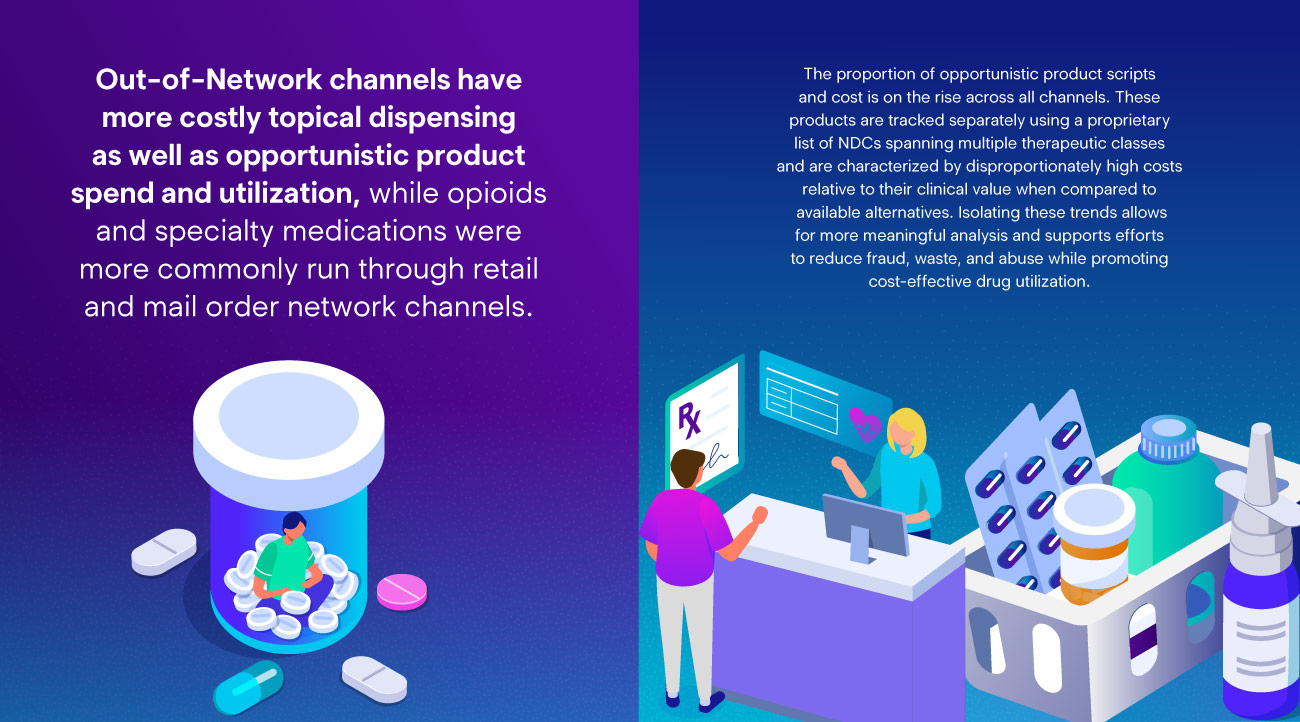
Scripts in the same therapeutic category cost on average 67% more when dispensed out-of-network compared to their in-network counterparts. When examining the top 10 in-network therapeutic classes by spend, the disparity is most pronounced for muscle relaxants (69% savings in-network) and topicals (62%). Even commonly-prescribed categories like NSAIDs and opioids show 35–38% savings when filled in-network.
Want the full view of workers’ comp and auto pharmacy trends?
Explore Enlyte’s 2026 Drug Trends Analysis series for insights on retail and mail-order prescriptions, opioids, topicals, specialty medications, network patterns, and more.
Methodology Statement
This information is based on all 2025 calendar-year retail and mail-order transactions billed through Enlyte’s Pharmacy Benefit Management (PBM) program to provide a more complete and accurate analysis.