


William Wilt
President, Assured Research
Executive Summary
Claims management does not operate in isolation. It responds to — and reflects — broader economic, legal and structural forces shaping the insurance market. Pricing cycles, inflationary pressures, labor dynamics, medical cost trends, litigation patterns and capital market performance all converge to influence loss ratios and operational strategy.
In this opening section, research and analysis firm Assured Research provides an independent, data-driven view of the macro environment. These signals form the foundation for everything that follows. Understanding where the market stands, and why, is essential to interpreting the severity trends, structural shifts and competitive dynamics reshaping claims performance in the year ahead.
Financial Results Are Strong — Pricing Pressure Often Follows
SIGNAL
Strong industry profitability has historically preceded softer pricing conditions.
The financial health of the P&C insurance industry is strong! Whether it is too strong and a catalyst for a broad-based downturn in pricing is a matter of some debate, but few would disagree that healthy balance sheets and prudent financial management are widely observed.
Figure 1 shows the tale of the tape for a broad swath of publicly traded P&C (re)insurers, which we believe to be broadly reflective of industrywide trends over time. Not only are current and forecasted returns expected to remain in the mid-teens, but the spread over the ‘risk free’ 10-Year Treasury is expected to exceed 10 points from 2023-2027. If that occurs, it will blow past the previous 2-year stretch of 2006-2007 which many will remember was the strong earnings aftermath of the 9/11 era hard market. (Results in 2006/07 also benefitted from benign storm seasons).
Leadership Takeaways
- Strong results can accelerate competitive behavior and pricing moderation
- Elevated ROEs increase the likelihood that pricing becomes the primary pressure point — even before loss trends worsen
What to Watch
- Track rate momentum by line (not only aggregate conditions)
- Monitor capital deployment signals (growth appetite, competitive intensity) alongside combined ratio performance
Supply (Capital) Is Growing Much Faster Than Demand (Economy) = Pricing Pressures
SIGNAL
When supply grows faster than demand, pricing tends to decline.
Every industry and business is grounded in the laws of supply and demand — P&C insurance is no different.
Let’s Consider Demand
It is true we are an industry that enjoys a relatively inelastic demand for our main products (and that is especially true for workers’ compensation and auto insurance, the main topics of this Trends Report). In short, for a business with employees and for people who own cars, those two products aren’t an optional purchase. Still, incremental demand for either is influenced by the economy and it’s there that we have concerns for the latter half of 2026 and into 2027. More on that shortly.
Looking at Supply
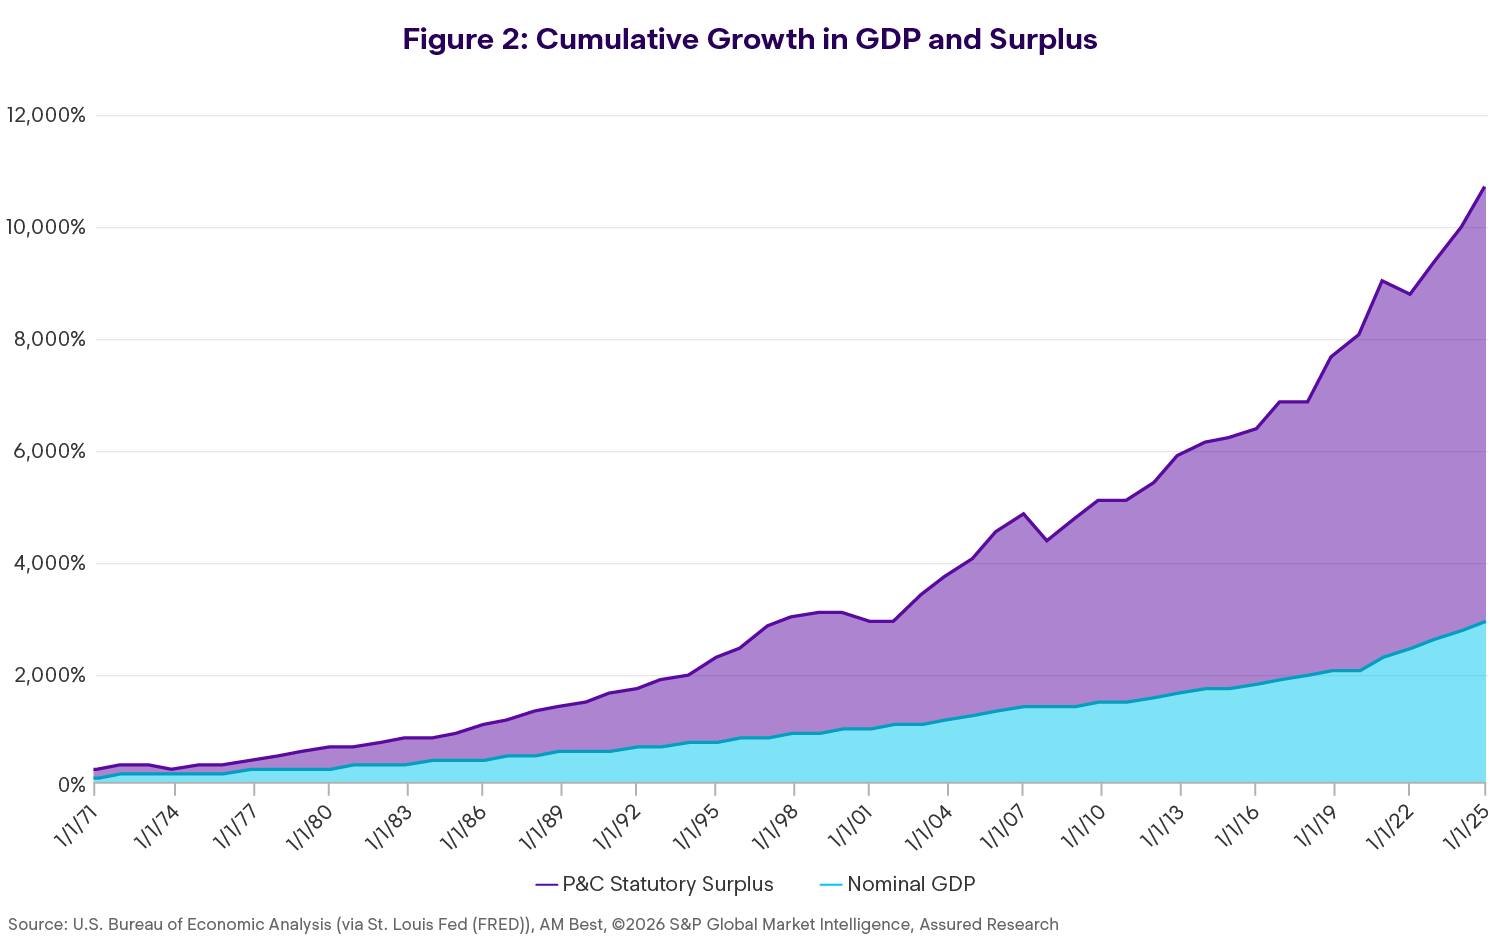
The growth in statutory surplus has far outstripped growth in U.S. nominal GDP (see Figure 2) with a notable acceleration in that difference starting around the turn of this century. It is true that surplus today must support greater risks than it did in the latter half of the 20th century — ubiquitous mass torts and aggressive litigation, massive natural peril risks, the list could go on.
But Figure 2 also makes clear the P&C pricing cycle is quite sensitive to changes in demand and the economy. There in turn changes in the economy — there is a substantial volume of capital (i.e., supply) chasing a demand function that grows at a rate more or less in line with GDP (and in the case of automobile growth — even lower).
And so, we turn to the pricing cycle.
Leadership Takeaways
- Capital abundance amplifies pricing competition
- Portfolio decisions in WC and auto are influenced by outcomes and capital needs in other lines
What to Watch
- Watch leading indicators of premium growth deceleration and capacity expansion
- Pressure‑test business plans against “lower demand + high capital” scenarios
P&C Rates Are Softening. Is There One Monolithic Cycle?
SIGNAL
Pricing remains correlated across lines, but divergence has increased.
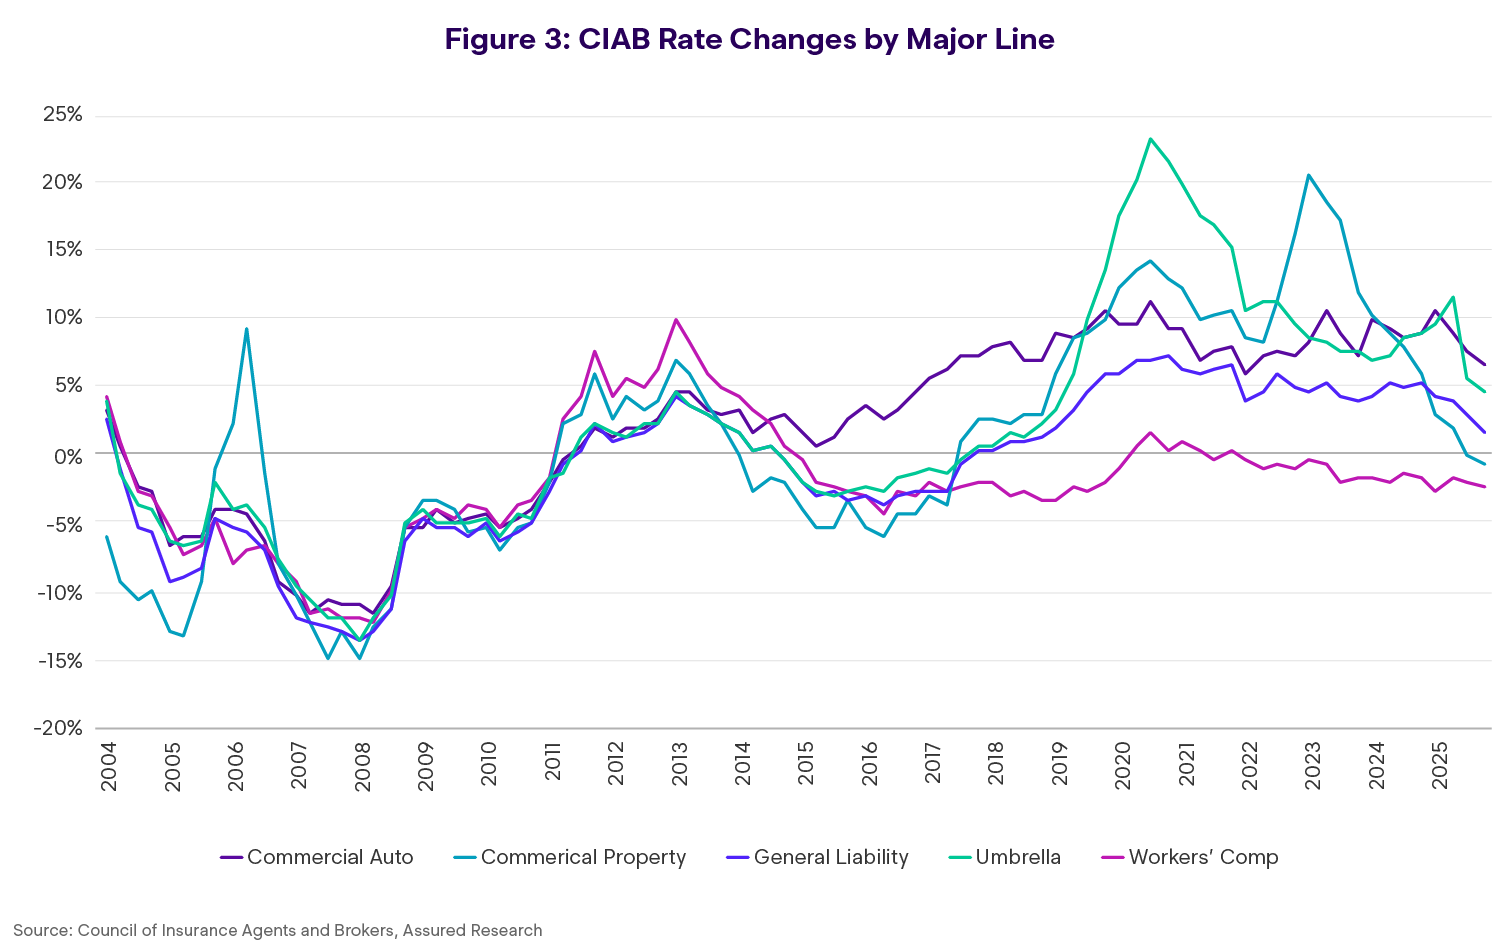
Having established that a substantial amount of supply is chasing a more slowly growing demand for P&C products, and with consideration of the generationally strong financial results shown in Figure 1, it isn’t surprising that the P&C rate environment is described as either softening (by brokers) or moderating (by carriers). What is more open for debate is the question of whether there is one monolithic insurance cycle. Our answer: Rate movements are still correlated, but not as strongly as they once were. Figure 3 illustrates our perspective, with rate changes across the five major insurance products moving in lockstep (mostly) through the late 20 to teens, after which we see a much wider spread across these series. To executives who assert, “There is no one pricing cycle,” we would say the evidence supports that hypothesis, although there is still a strong correlation across the lines.
Leadership Takeaways
- “One cycle” thinking is less reliable; line‑level dynamics matter more
- Decision‑making requires a portfolio view but underwriting and claims outcomes will be increasingly line‑specific
What to Watch
- Treat pricing strategy as line‑specific with shared macro constraints
- Recalibrate planning assumptions for higher variance across lines
An Unpredictable Economy Will Impact WC and Auto Insurance
SIGNAL
Demand for WC and growth in auto insurance are fundamentally linked to the health of the economy — and uncertainty is elevated into late 2026 and 2027.
Viewed through the lens of an industry analyst, the years after the Great Financial Crisis (GFC) and before the pandemic were … rather boring. After the economy stabilized, GDP growth and inflation were tame — around 2% — and P&C insurers reported decent, if unspectacular results. Most of us remained unaware that storm clouds in the form of legal system abuse (LSA) were gathering. LSA (as shared in Chubb’s annual shareholder letter) is estimated as a tax on the typical American household of around $4,000, aggregating to around 2% of U.S. GDP.
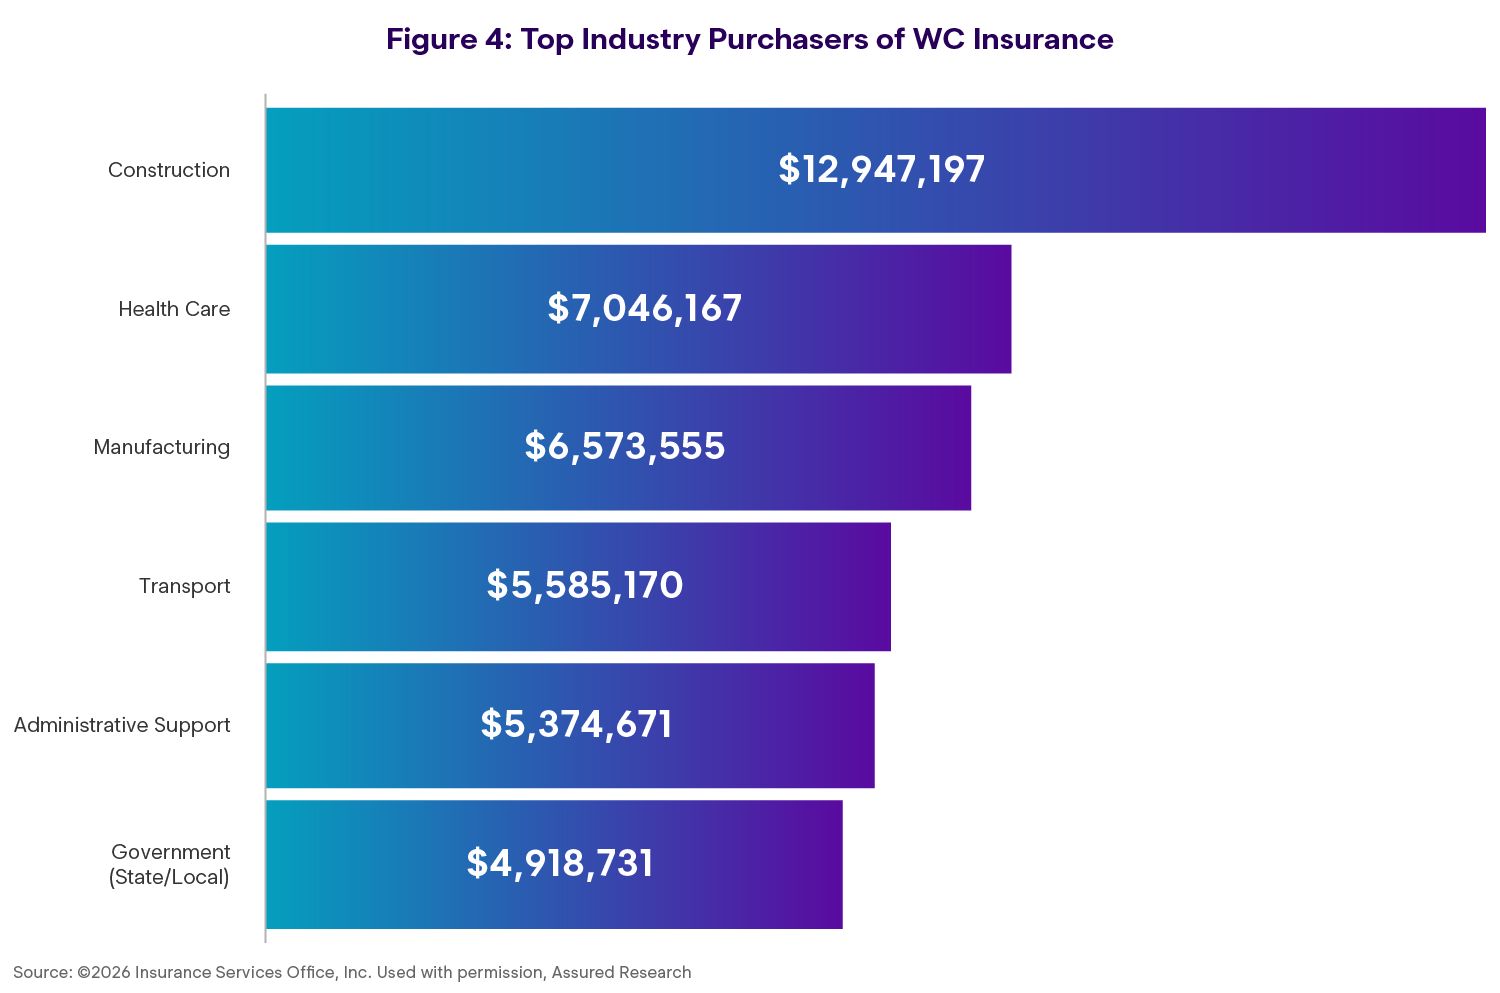
Boring is not a word that comes to mind when thinking about the economy and its impact on P&C insurers for the remainder of 2026 and into 2027. The impacts of the One, Big, Beautiful Bill (OBBB) Act are still unfolding as are myriad policy changes at the federal level (e.g., changes to immigration are having an immediate impact on long-haul trucking and construction; two industries that purchase billions of workers’ compensation insurance (Figure 4). As we will explain later in the section on workers’ compensation, people moving off Affordable Care Act health plans could become more likely to file a WC claim if they either drop coverage altogether or move onto a high-deductible, employer-sponsored plan.
Our outlook for the economy is relatively more bearish than the Fed’s median projections for real GDP growth and the unemployment rate in 2026 at 2.4% and 4.4%, respectively. Estimates are always subject to change, but immediately following the start of the war with Iran, Goldman Sachs and others revised their economic outlooks downward. Goldman’s estimated 2H26 GDP growth was moved to just 1.25-1.75%; a level that is barely treading water. Now, small misses to those figures shouldn’t impact results in workers’ compensation or auto insurance too materially (that is, the pricing cycle and topics addressed in later sections will outweigh minor economic variations), but as to the overall P&C market, the economy matters, with even modest variations in demand influencing the pricing cycle. As ever, no business or industry can break from the laws of supply/demand. There is over $1 trillion in insurance capital chasing an unpredictable level of demand.
As to what we will be watching, the answer is construction and retail trade. Construction is the largest purchaser of both workers’ compensation and commercial insurance (at $71B) while retail ranks sixth in overall commercial purchases. But our past analyses have demonstrated that the commercial and retail sectors are the most statistically correlated with industry premium growth. And while most people are familiar with the positive story around the building of data centers, the series showing construction and retail sales have been flat-to-down, after accounting for inflation, since late 2024.
Leadership Takeaways
- Demand variability matters more in a capital‑rich market
- Sector‑specific economic weakness can show up first in WC and commercial insurance purchasing patterns
What to Watch
- Monitor construction and retail activity as leading indicators for premium growth sensitivity
- Pair economic monitoring with early claim signals (frequency, duration, severity mix) once Sections 2–3 data is integrated