

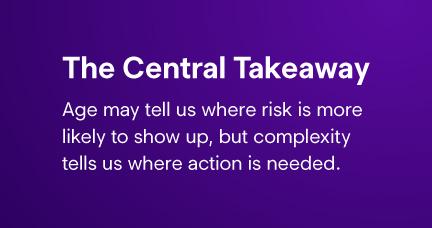
In The Aging Workforce Enlyte explained why workforce age matters. This follow-up uses Enlyte’s own data to look more closely at what changes claim outcomes: not age alone, but the clinical, treatment and psychosocial complexity that often accumulates around a claim. Medical spend rises across age bands, complexity factors become more common and mental health creates a meaningful cost and treatment duration gap. Age may signal where risk is more likely to emerge, but complexity reveals which claims need earlier, more focused intervention.
Table of Contents
From an Aging Risk to Claim Complexity
Complexity Builds with Age
The Mix of Complexity Changes with Age
More Factors, More Cost
Mental Health Follows a Different Curve
Lower Frequency. Bigger Impact.
What Claims and Clinical Teams Can Do Differently
The Bottom Line
Methodology and Data Notes
From an Aging Risk to Claim Complexity
The Aging Workforce established a broader risk picture that older employees are not necessarily injured more often, but their injuries can be more serious, recovery can take longer and chronic conditions can make return to work harder. This paper tests the assertion against Enlyte data, looking at dates of injury years 2020-2024 and a separate 2024 mental health analysis, both valued at 18 months.
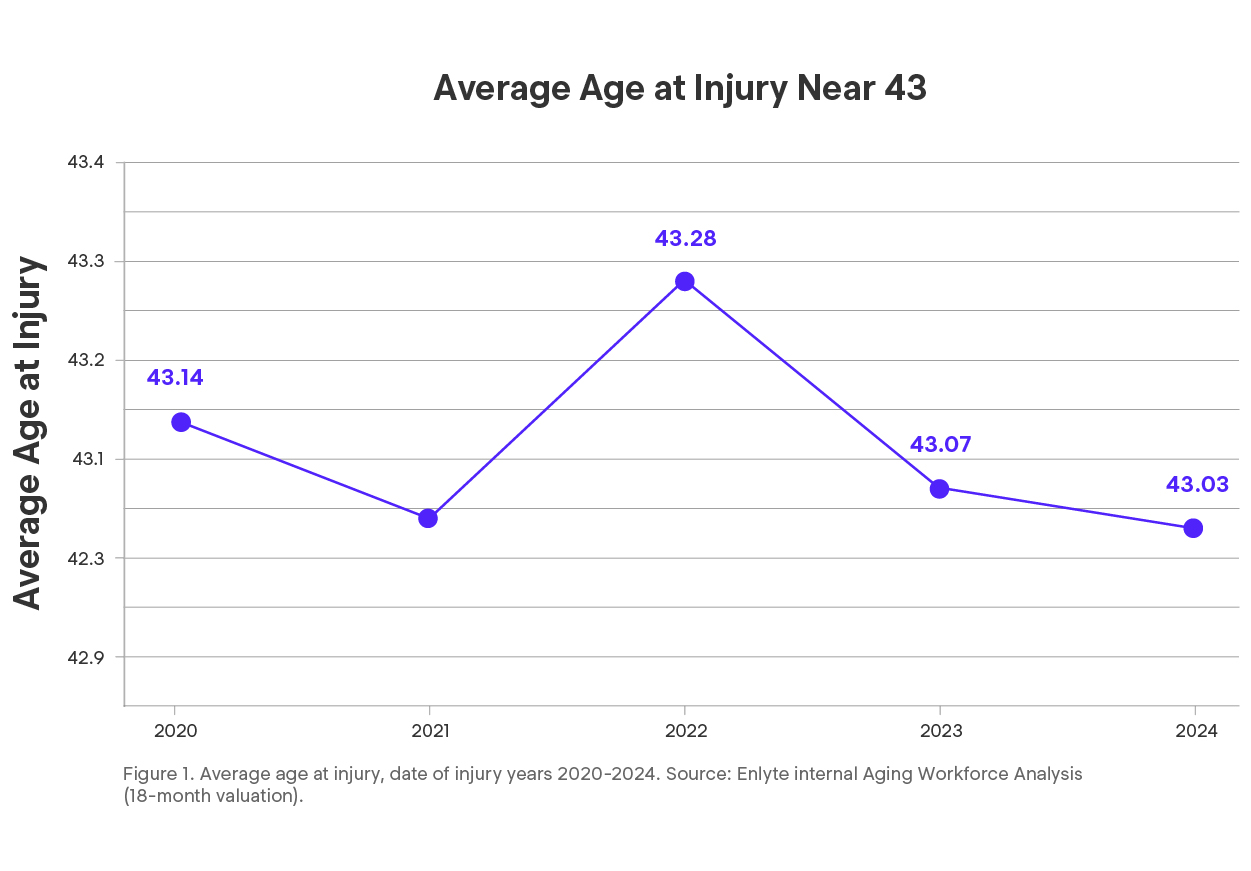
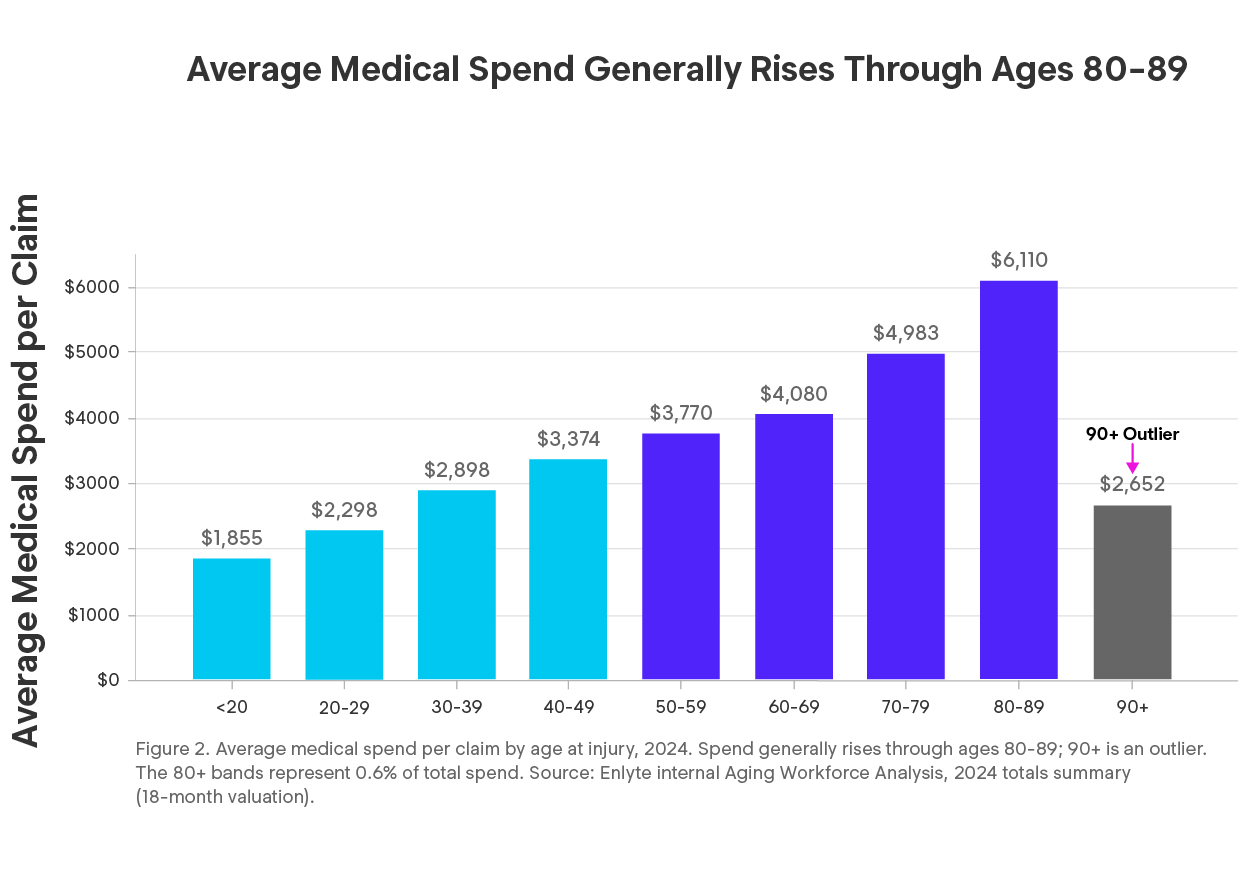
The average age at injury stayed close to 43 from 2020 through 2024, so the story is not that the workforce suddenly became older. The cost curve shows the shift. In 2024, average medical spend per claim rose from $1,855 for employees under age 20 to $4,080 at ages 60-69 and $4,983 at ages 70-79. Ages 50-69 accounted for 40.5% of total spend. Across the 2024 age bands, average spend generally rose 8%-26% from one group to the next through ages 80-89; 90+ was an outlier. A stable average age can still mask changing claim performance underneath it, making age useful context but not a stand-alone risk score.
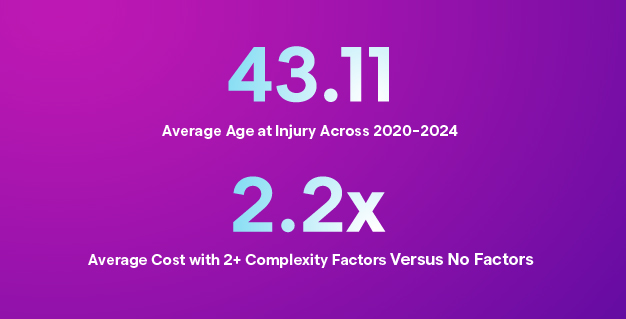
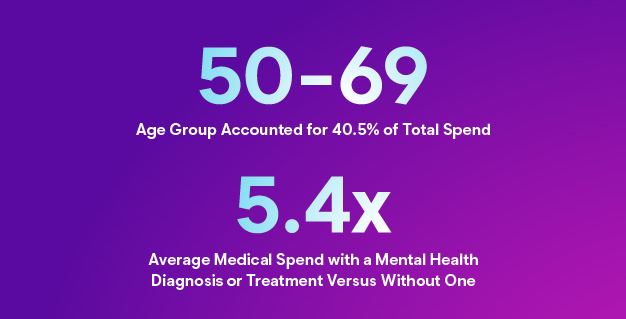
Source note: 43.11 and 40.5% - Enlyte internal Age Mix and Claim Cost Analysis; 2.2x -Enlyte internal Complexity Factors and Mental Health Impact Analysis; 5.4x - Enlyte internal 2024 Mental Health Analysis (18-month valuation).

Complexity Builds with Age
A complexity analysis across 379,299 claims in 2020 to 2024 looked at the following complexity factors: diagnoses, health behaviors and treatment-related indicators: depression, diabetes, hypertension, obesity, opioid exposure, smoking, substance abuse, surgery and pre-existing conditions. Because not every item is a comorbid diagnosis, this paper uses complexity factor when referring to the full group.
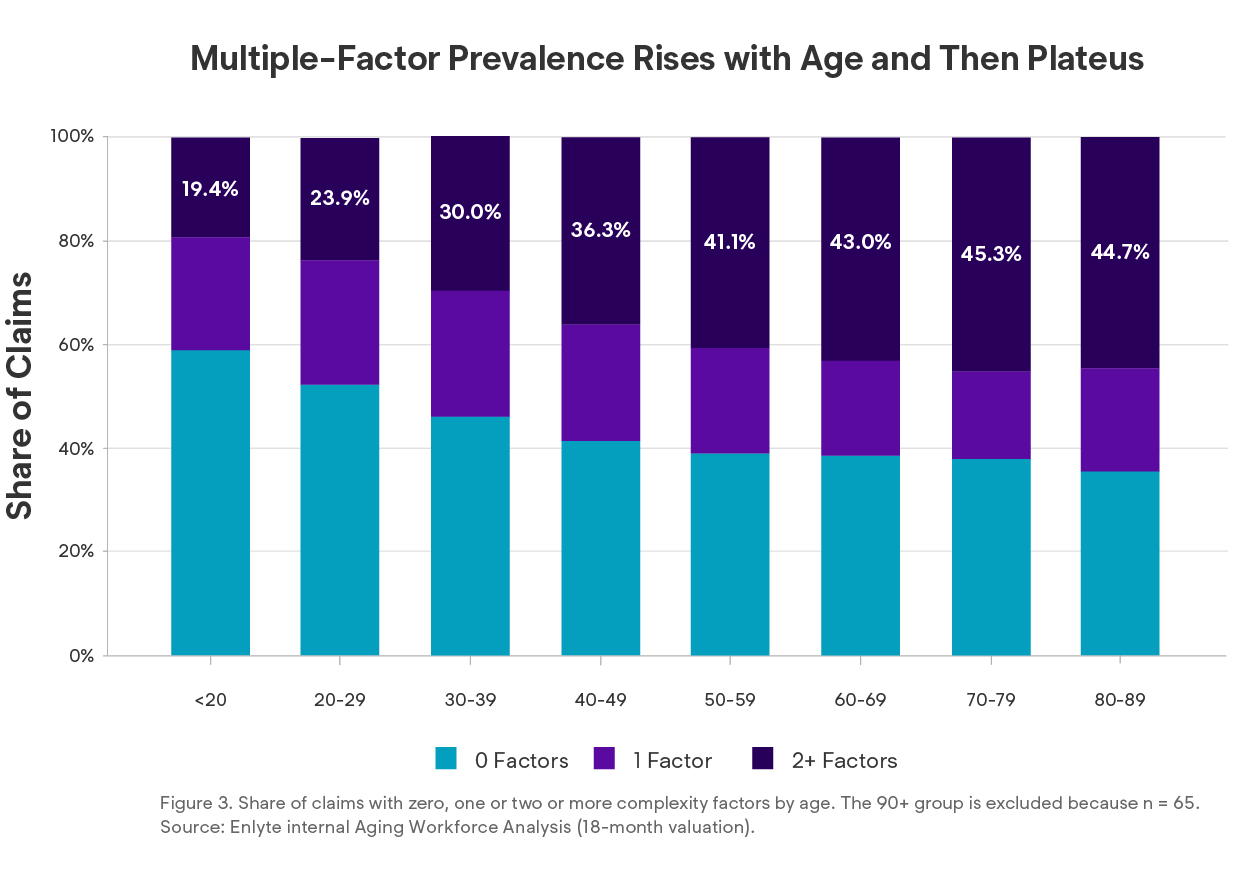
57% of claims had at least one identified complexity factor. More importantly, the share with two or more factors increased from 19% among employees under age 20 to 41% at ages 50–59, 43% at 60–69 and 45% at 70–79. We exclude the 90+ group from the trend charts because it includes only 65 claims, so readers should not use it for broad conclusions.
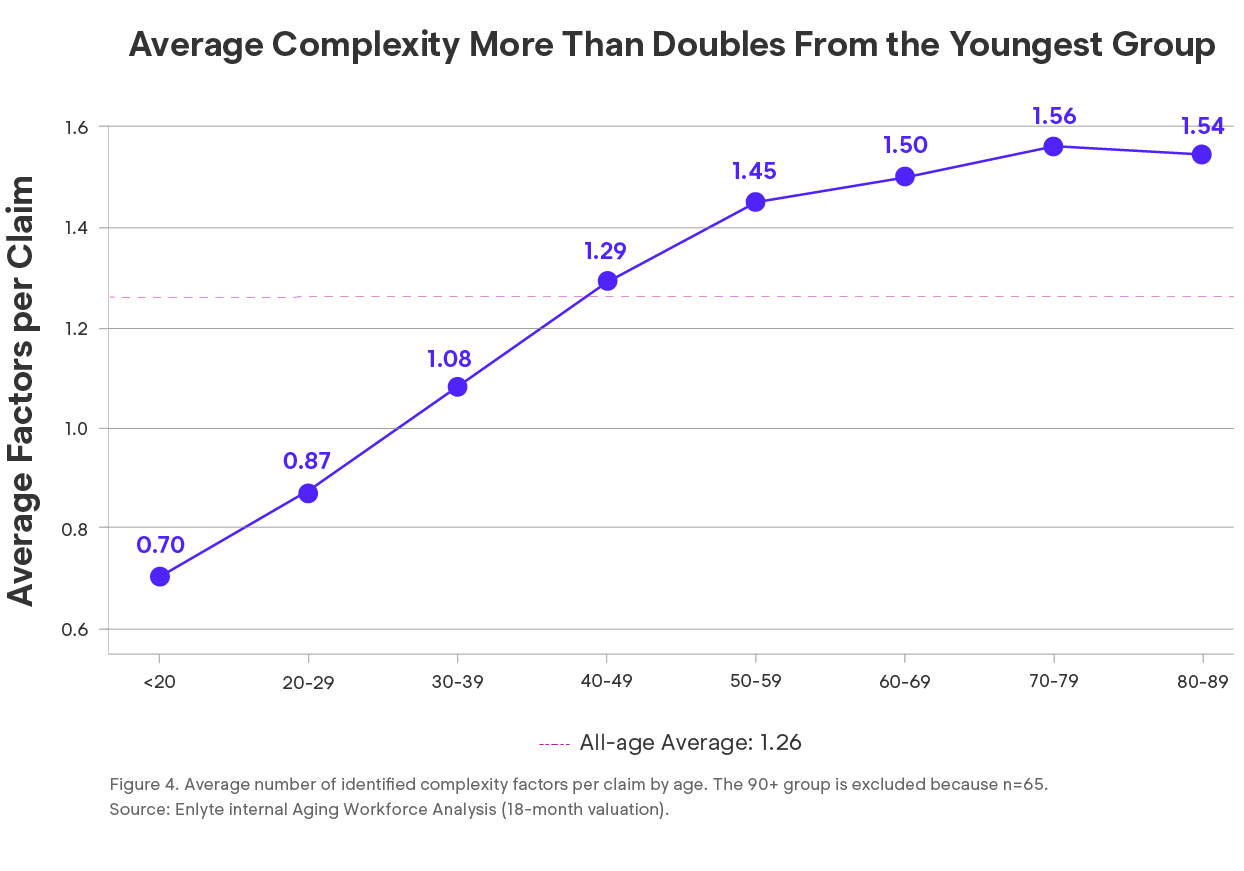
The claim’s complexity profile points in the same direction. Average count rises from 0.70 per claim among employees under age 20 to 1.45 at ages 50–59, 1.50 at 60–69 and 1.56 at 70–79. This is not simply a shift from no factors to one factor. Older-employee claims are more likely to involve multiple issues that can shape care, recovery and return-to-work planning. For claims and clinical teams, that complexity profile should carry more weight than age alone.
In practice, the second and third risk factors are often where claim management changes. A single issue may fit within a standard pathway; multiple factors can introduce competing priorities, slower functional progress and more opportunities for care to fragment.
The Mix of Complexity Changes with Age
Both the number and type of factors matter because different combinations point to different clinical responses. Obesity peaks at 35% in the 40–49 age band and then declines. Hypertension moves in the opposite direction, increasing from 17% at ages 40–49 to 27% at 50–59, 33% at 60–69 and 40% at 70–79. Surgery and opioid exposure continue to increase across the older age bands, while diabetes rises through ages 70-79 before easing at ages 80-89.
That shift is consistent with the broader health context. NIOSH’s Aging and Work guidance identifies arthritis and hypertension as two of the most common conditions affecting older employees. Age should not become a shortcut for decision-making. Teams need to consider the specific combination of health, treatment and psychosocial factors shaping the claim.
The Factor Mix Shifts with Age | Share of Claims with Each Identified Complexity Factor
| Obesity | 17% | 26% | 32% | 35% | 34% | 29% | 23% | 14% |
|---|---|---|---|---|---|---|---|---|
| Smoking | 7% | 10% | 12% | 13% | 11% | 10% | 7% | 5% |
| Depression | 10% | 10% | 11% | 11% | 10% | 9% | 10% | 7% |
| Substance Abuse | 1% | 2% | 2% | 2% | 1% | 1% | 1% | 1% |
| Pre-existing Condition | 3% | 4% | 5% | 6% | 7% | 7% | 7% | 6% |
| Opioid Exposure | 12% | 12% | 14% | 15% | 16% | 17% | 19% | 23% |
| Diabetes | 1% | 1% | 4% | 8% | 13% | 16% | 19% | 15% |
| Surgery | 18% | 18% | 20% | 23% | 25% | 27% | 30% | 38% |
| Hypertension | 1% | 3% | 8% | 17% | 27% | 33% | 40% | 45% |
| Age at Injury | <20 | 20–29 | 30–39 | 40–49 | 50–59 | 60–69 | 70–79 | 80–89 |

5. Prevalence of identified complexity factors by age. Darker cells indicate higher prevalence. The 90+ group is excluded because n = 65. Source: Enlyte internal Aging Workforce Analysis (18-month valuation).
More Factors, More Cost
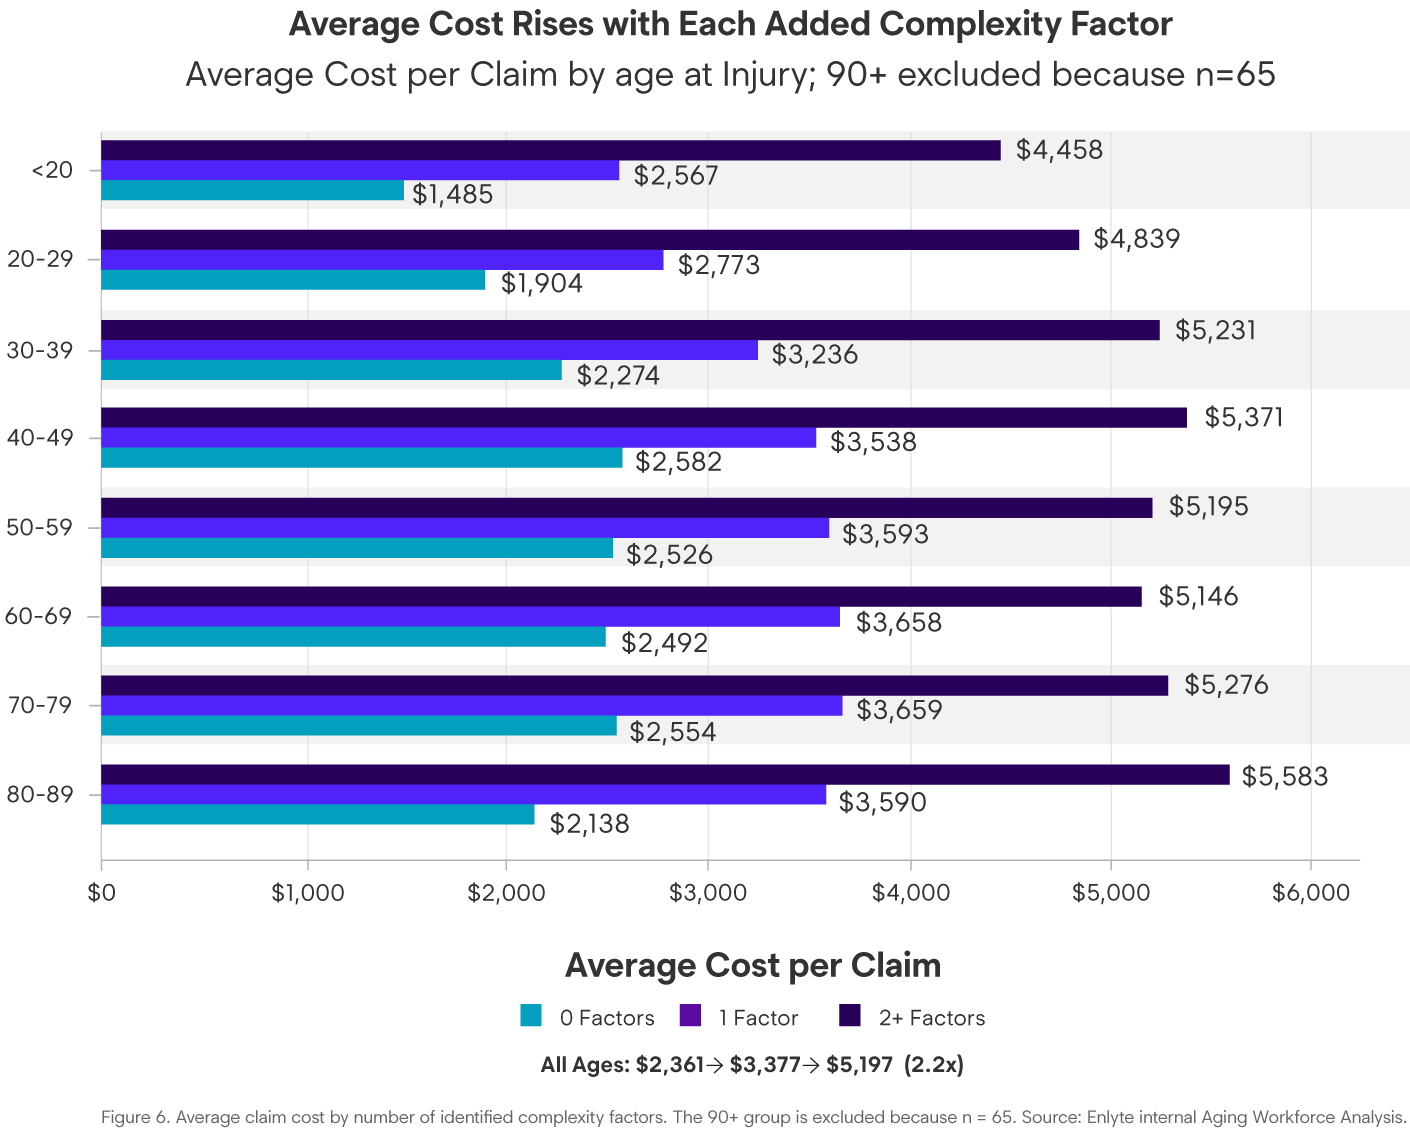
Cost rises at each step of complexity. Across all ages, claims with no identified factors averaged $2,361. Claims with one factor averaged $3,377, a 43% increase. Claims with two or more factors averaged $5,197, 54% above one-factor claims and about 2.2 times the average for claims with no factors.
Mental Health Follows a Different Curve
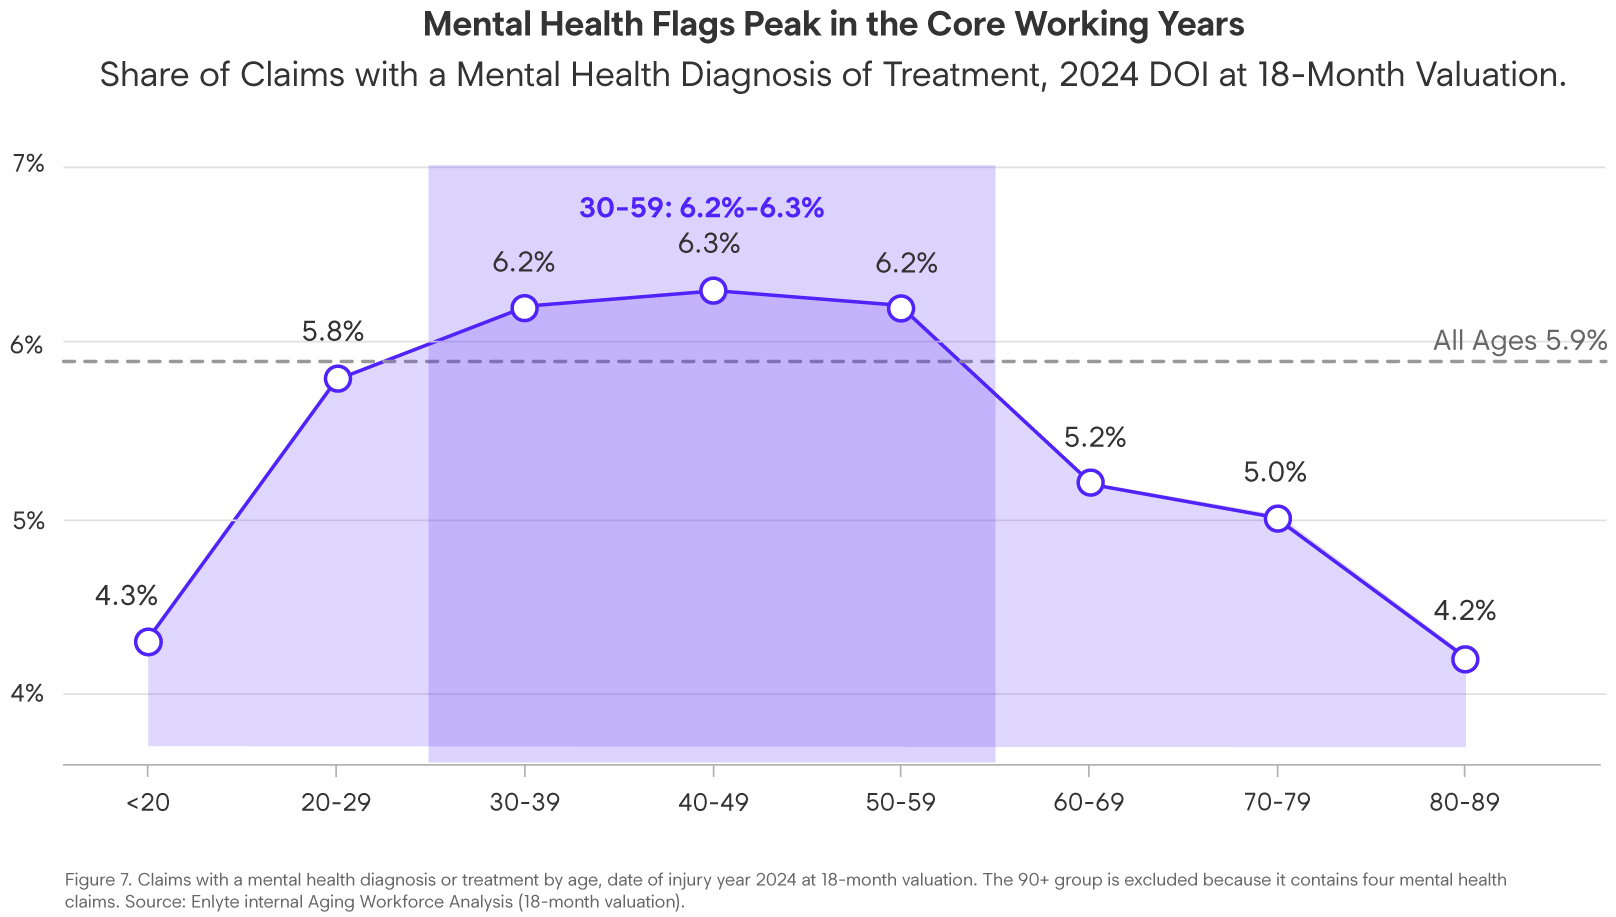
Mental health diagnoses do not increase with age in the same way physical complexity does. In the 2024 Enlyte analysis, 5.9% of claims had a mental health diagnosis or treatment. Prevalence rose from 4.3% among employees under age 20 to 6.2%–6.3% across ages 30–59, then declined to 5.2% at 60–69, 5.0% at 70–79 and 4.2% at 80–89. We exclude the 90+ estimate from the chart because it includes only four mental health claims.
That does not mean screening should focus only on younger and mid-career employees. Mental health diagnosis and treatment is less common in older age groups, but when it appears, the cost and treatment-duration differences remain large.

Lower Frequency. Bigger Impact.
Across all ages, claims with a mental health diagnosis or treatment averaged 187 treatment days, compared with 53 days without. That is a 3.5-fold difference. Average medical spend was $19,647 versus $3,626, or about 5.4 times as high. The analysis shows a clear association, not proof, that mental health caused the difference, but it is still the largest cost and treatment-duration gap observed across these analyses.
The size the mental health diagnosis differential makes early screening important. It is most useful before barriers are obvious enough to affect treatment planning, communication and return-to-work expectations.
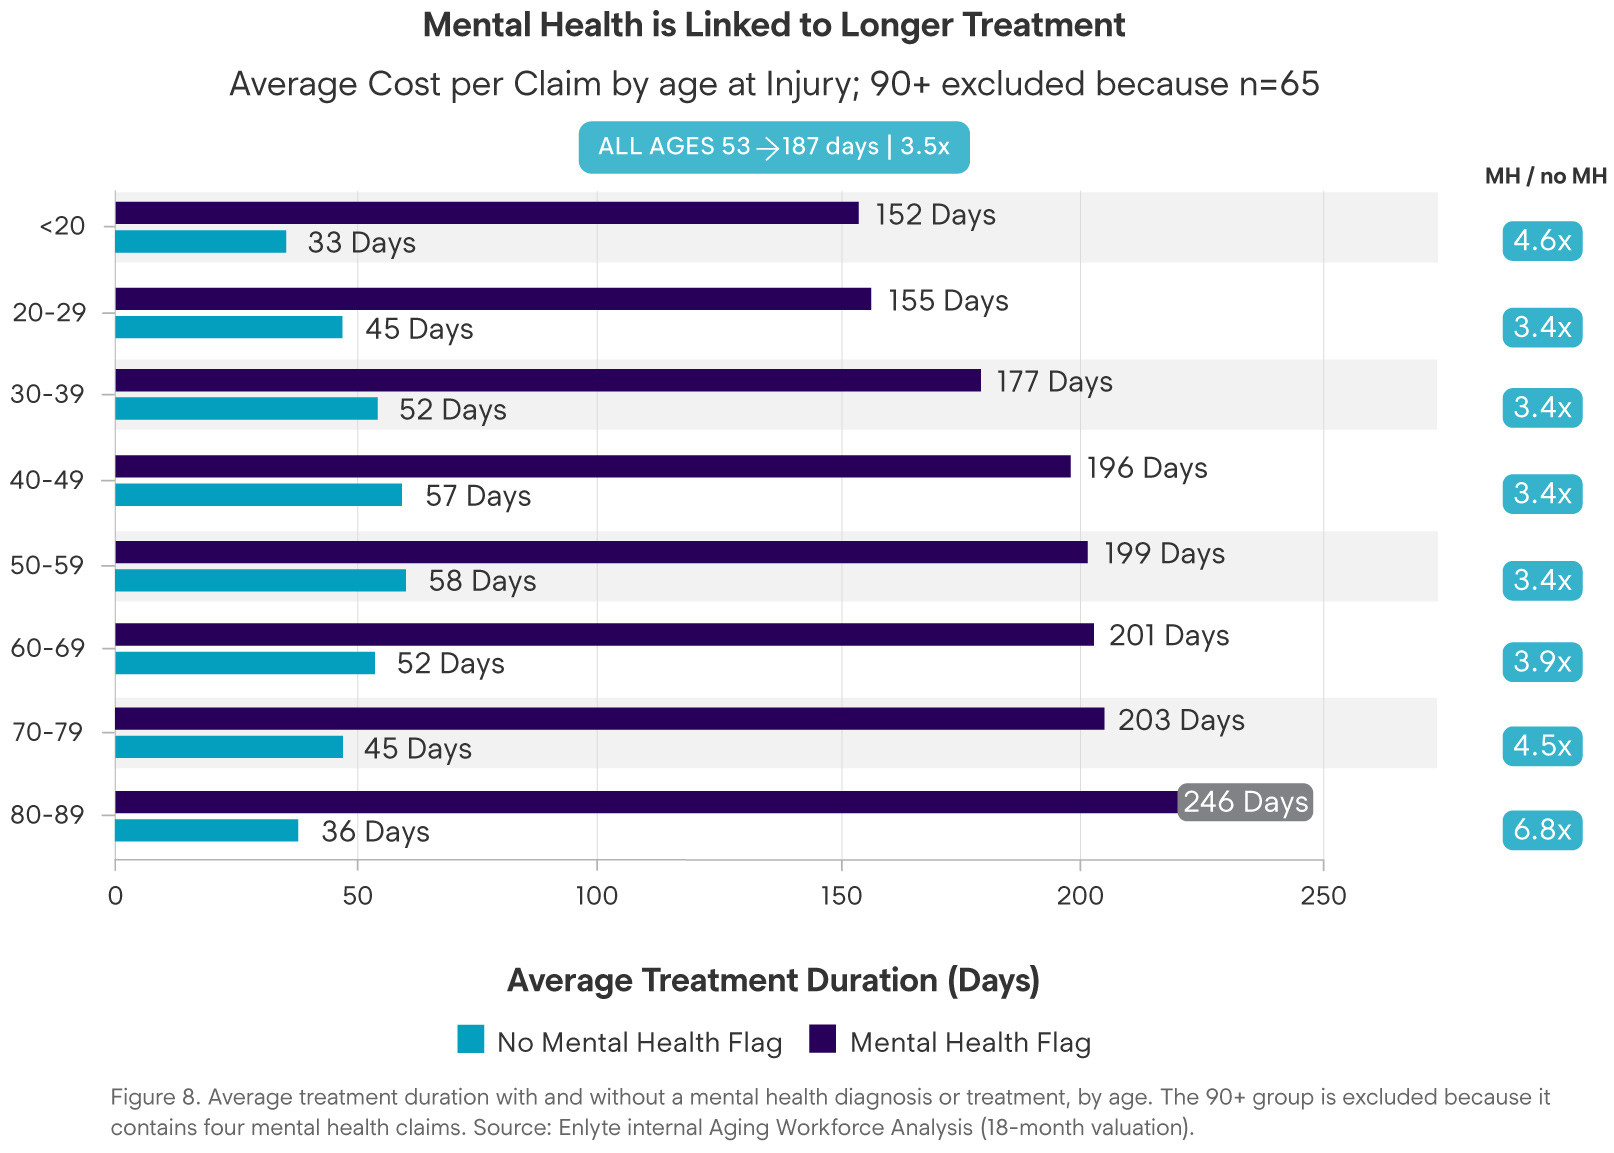
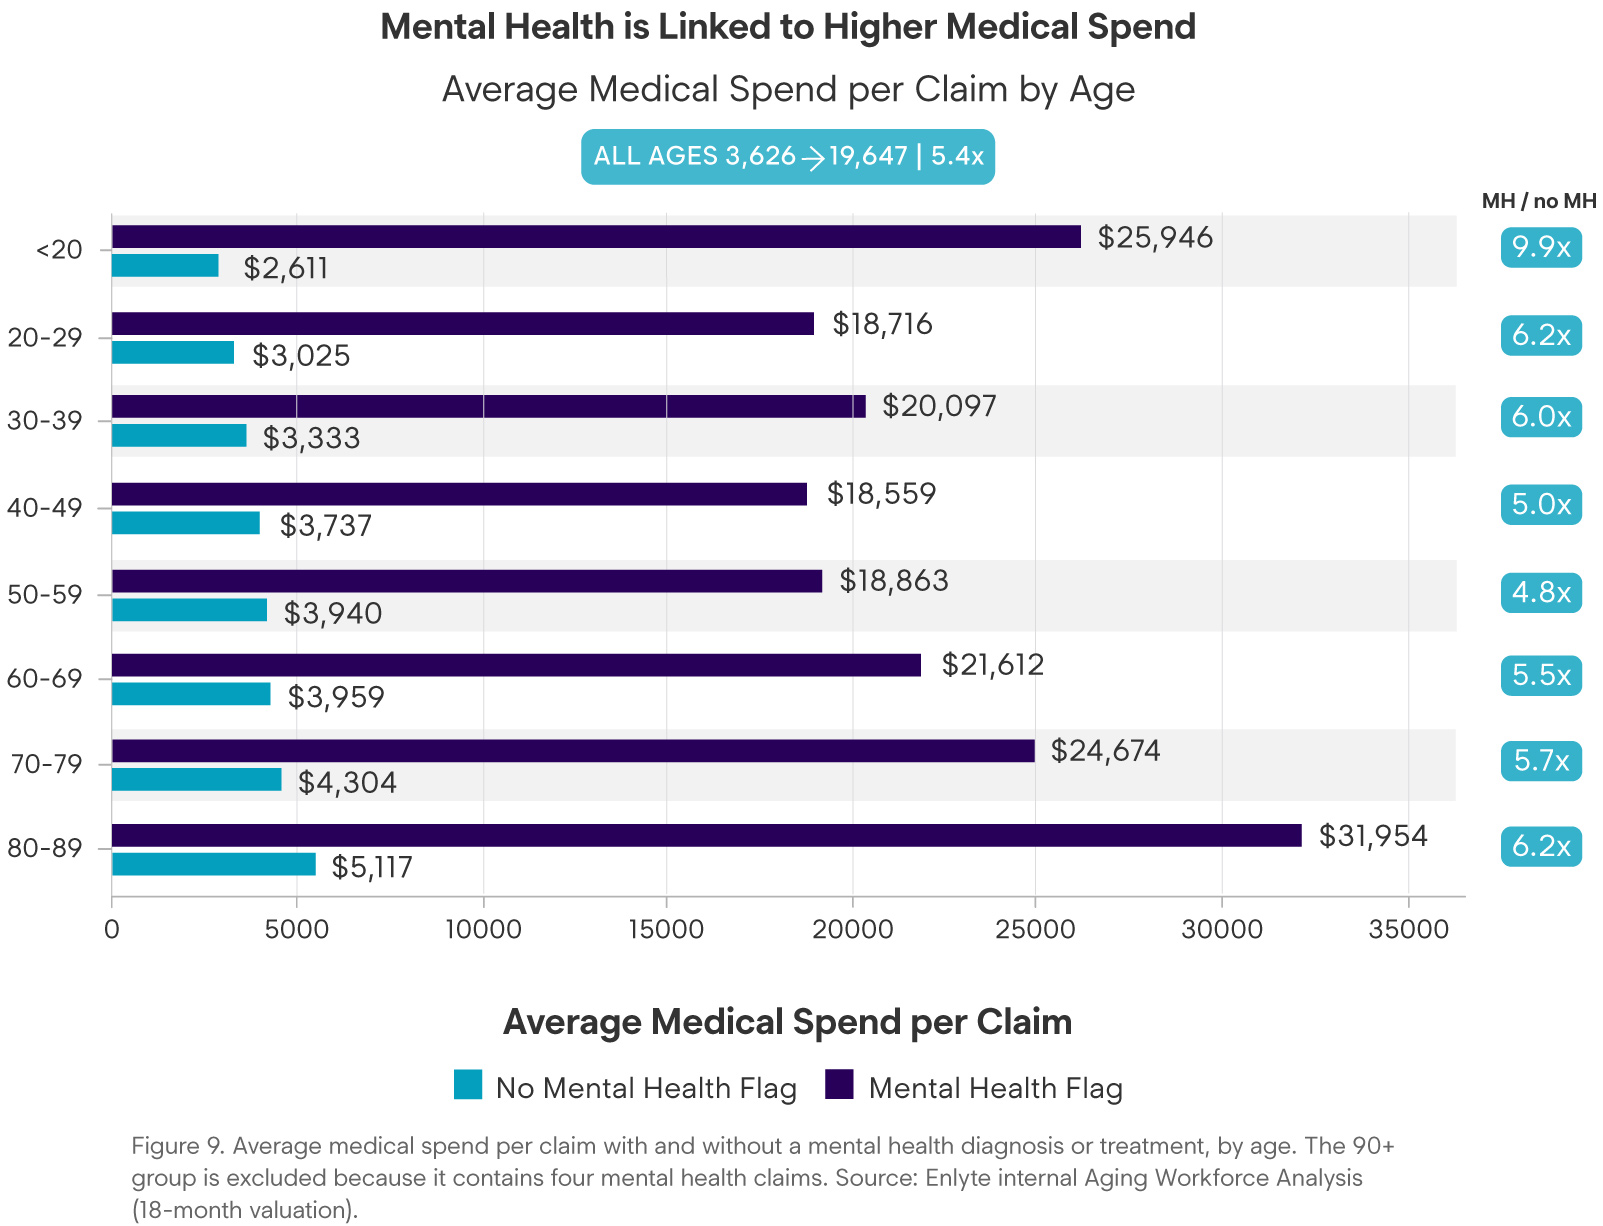
This matters most in the older age bands. At ages 60–69, claims with a mental health flag averaged 201 treatment days versus 52 without one. At 70–79, the comparison was 203 days versus 45. Average medical spend reached $21,612 at ages 60–69 and $24,674 at 70–79. At ages 80–89, the analysis shows $31,954 and 246 treatment days; although that result is based on 59 mental health claims and should be treated as directional.
Enlyte’s Behavioral Health Trends in Workers’ Compensation analysis of 2025 lost-time claims found nearly four times the medical cost and more than twice the treatment duration when behavioral health treatment was present. The exact multipliers differ because the populations and valuation periods differ, but the direction is consistent.

What Claims and Clinical Teams Can Do Differently
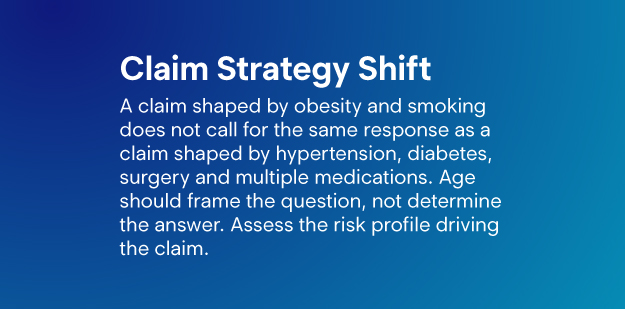
- Use complexity as the triage trigger, not age alone: Use claim data, factor count, factor combinations, treatment indicators and mental health flags to identify complexity early and guide the right level of support.
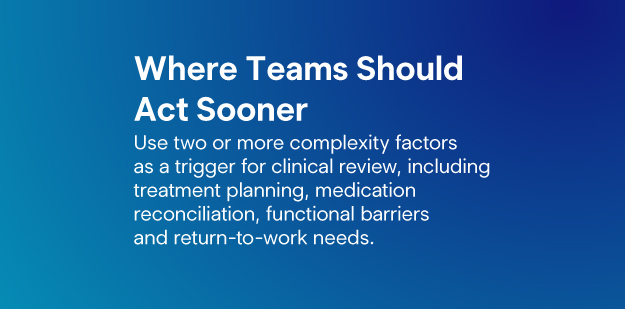
- Escalate earlier when two or more complexity factors are present: Treat two or more factors as a trigger for focused clinical review, including physical and psychosocial barriers to recovery.
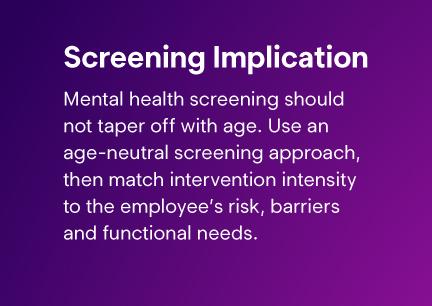
- Screen for mental health across all age bands: Lower prevalence in older groups does not mean lower impact to cost and treatment duration.
- Connect treatment planning to function and job demands: Tie care to measurable functional milestones and specific work requirements, not only to symptom improvement.
- Build return-to-work planning into the claim strategy earlier: Develop realistic transitional-duty options and translate restrictions into tasks supervisors can use.
- Focus operational attention on ages 50-69: This group represented 40.5% of total 2024 spend, combining high claim volume with rising per-claim cost.
This aligns with NIOSH’s Aging and Work guidance, including matching tasks to abilities, controlling slip and physical hazards, using ergonomic design, coordinating accommodations after injury and supporting employee health across the working life. The goal is not more activity on every claim; it is earlier intervention when the complexity profile points to greater risk.
The Bottom Line
The Aging Workforce framed workforce age as a demographic, safety and return-to-work challenge. This follow-up shows why age is only the starting point. Although the average age at injury did not rise during the study period, cost and complexity changed meaningfully across age bands.
Older age groups were more likely to have multiple complexity factors, with the mix shifting toward hypertension, surgery, diabetes and opioid exposure. Claims with two or more factors cost about 2.2 times as much as claims with no identified factors. Mental health appeared in a smaller share of claims, but when present, it was associated with the largest cost and treatment duration differential in the analysis.
That distinction matters because the wrong signal can lead teams to intervene too late or on the wrong claims. The greater risk is not aging itself; it is missing the complexity signals that should change the claim strategy sooner. For claims and clinical leaders, the opportunity is to treat age as context, complexity as direction and function as the measure of progress.

Methodology and Data Notes
- Age mix and medical spend: Enlyte internal age-mix and medical-spend analysis. Date of injury years 2020-2024. Figure 2 and the 40.5% total-spend statistic use the 2024 totals summary, which reports average medical spend per claim and total spend share by age.
- Complexity-factor analysis: Enlyte internal complexity-factor analysis. The cohort includes 379,299 claims across date of injury years 2020-2024 combined. The analysis includes depression, diabetes, hypertension, obesity, opioid exposure, smoking, substance abuse, surgery and pre-existing conditions.
- Mental health analysis: Enlyte internal mental health analysis. The cohort includes 508,186 claims from the date of injury year 2024 at 18-month valuation. Of these, 30,145 had a mental health diagnosis or treatment.
- Different populations: The age/cost, complexity-factor and mental health analyses use different claim populations and valuation frames. Interpret their prevalence rates within each cohort, not combined into one population.
- Duration metric: The mental health analysis reports average treatment duration. It should not be read as disability duration.
- Association, not causation: The analysis is descriptive. Factors may correlate with injury severity, treatment type, claim maturity and other characteristics that are not controlled for in the tables.