


Michele Hibbert
Senior Vice President, Regulatory Compliance Management

Ed Olsen
Director, Claims Performance Consulting, CPCU
Executive Summary
Medical severity — not overall claim frequency — emerges as the defining trend across 2022–2025 loss years. Enlyte data is consistent with NCCI and WCRI reporting, overall workers’ compensation claim frequency remains flat to declining nationally. The notable change within this dataset is not the number of claims occurring across the system, but rather how medical services are being delivered, accessed, and utilized within existing claims.
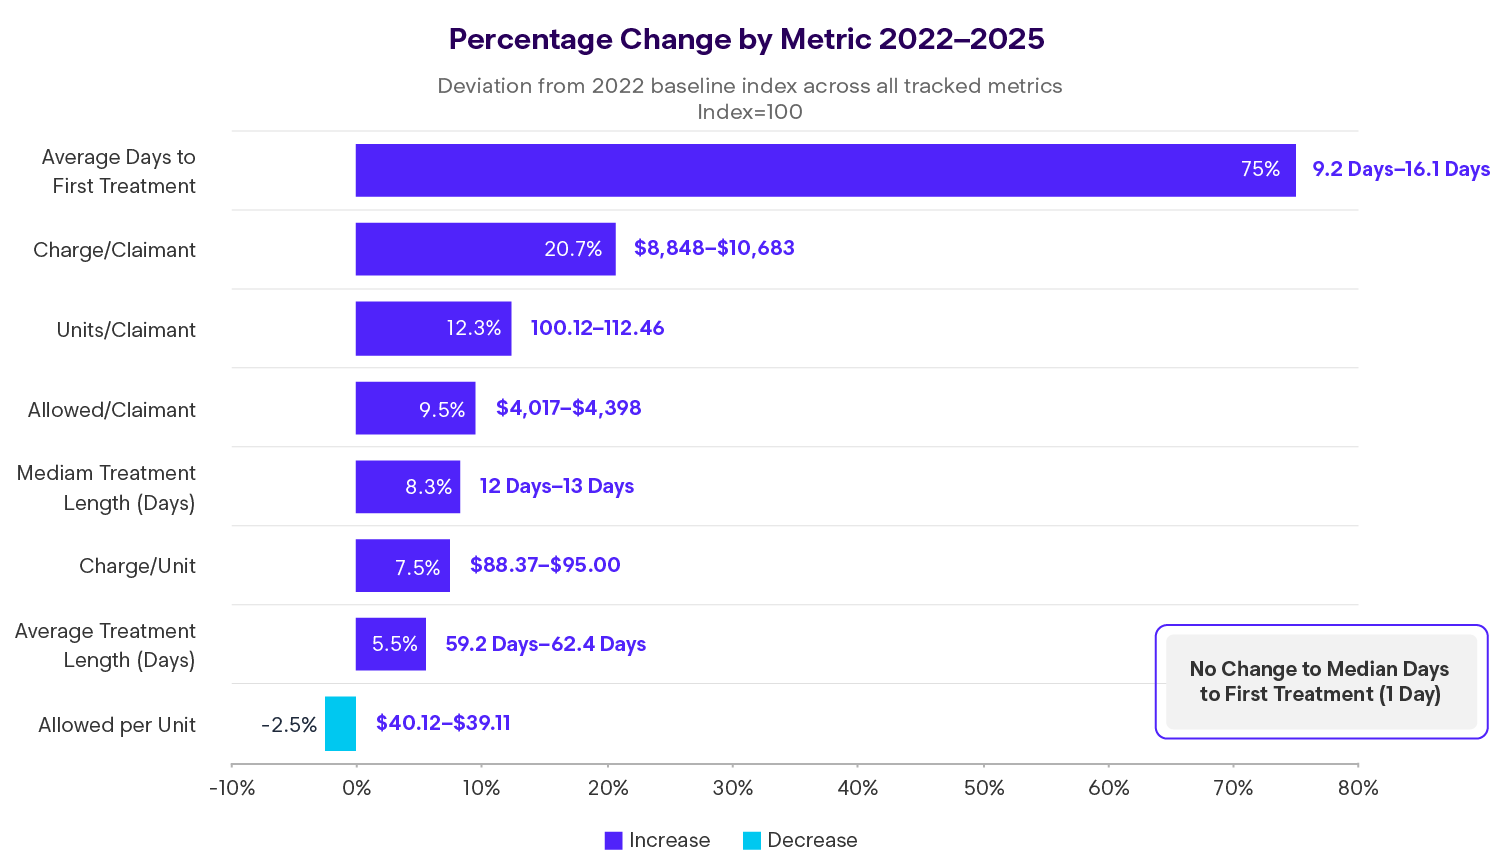
Allowed medical cost per claimant increased 9.5% over the four-year period, reaching average allowed amounts at $4,398 in 2025, despite effective containment of unit pricing. The primary driver of higher per-claimant cost is greater utilization intensity — claimants are receiving more services within broadly similar treatment durations.
Another notable development is a widening divergence in time to first treatment. While the median injured worker continues to access care immediately, a subset of claimants is experiencing materially longer delays before initiating non-emergent care. This bifurcation suggests structural differences in access pathways rather than systemic access failure. Given the lack of recent industry-wide studies on time-to-treatment, this dataset fills an important gap and provides a valuable reference point for current market behavior.
National Trends Summary (2022–2025)
Market Overview: Cost Growth Driven by Utilization Intensity
Allowed cost per claimant rose modestly in 2023 and 2024 before accelerating in 2025, increasing 5.3% year over year. This increase occurred despite a 2.5% decline in allowed cost per unit over the four-year period, underscoring the effectiveness of fee schedules, network pricing, and negotiated rates.
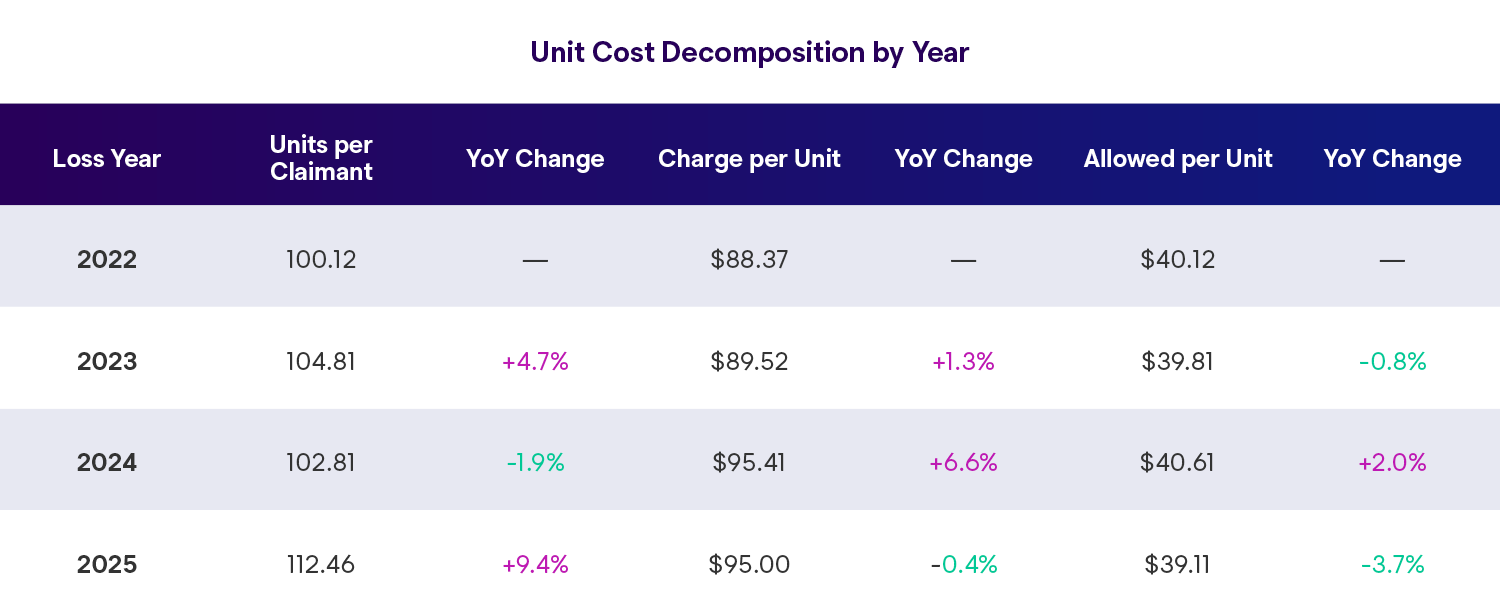
The increase in total allowed dollars per claimant is explained primarily by units of service per claimant, which rose 12.3% from 2022 to 2025. In other words, medical inflation within this period is being driven by how much care is delivered, rather than the price paid for each unit of care.
This pattern highlights the growing importance of utilization management, network performance, and care coordination as primary levers for medical cost control
Utilization Trends: A Shift in Care Delivery
Across the dataset, claimants received an average of 112.5 units of service in 2025, compared to 100.1 units in 2022. This increase occurred without a corresponding expansion in average treatment length, which rose only 5.5% over the same period.
The implication is not extended claim duration, but greater service density within treatment episodes. This may reflect more frequent visits, additional modalities within visits, or increased layering of conservative care prior to authorization of higher-cost interventions.
Importantly, this utilization pattern appears to be concentrated within specific datasets and client populations rather than reflecting a uniform industry-wide surge. External benchmarks continue to report stable claim frequency, reinforcing that observed volume growth is best interpreted as case-mix and exposure-driven, not systemic claim expansion.
The Discount Rate Expansion
Notice the widening gap between charged per unit (+7.5% over four years) and allowed per unit (-2.5%). In 2022, payers allowed an average of $45.37 for every $100 billed by providers. By 2025, that had fallen to $41.17 per $100 billed — a 4.2 percentage point expansion in the discount rate.
Translation: Fee schedules and payment policies are successfully constraining unit costs, but providers are partially offsetting this through volume increases. The tension between fee schedule discipline and utilization management has never been more apparent.
Treatment Patterns
Treatment Initiation: Diverging Access Patterns
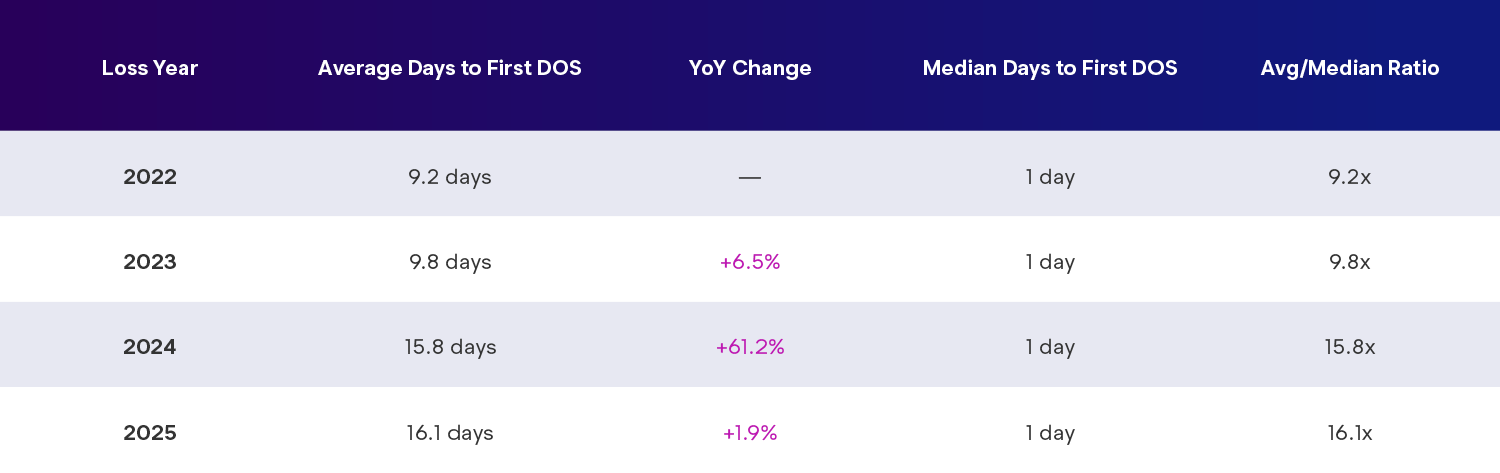
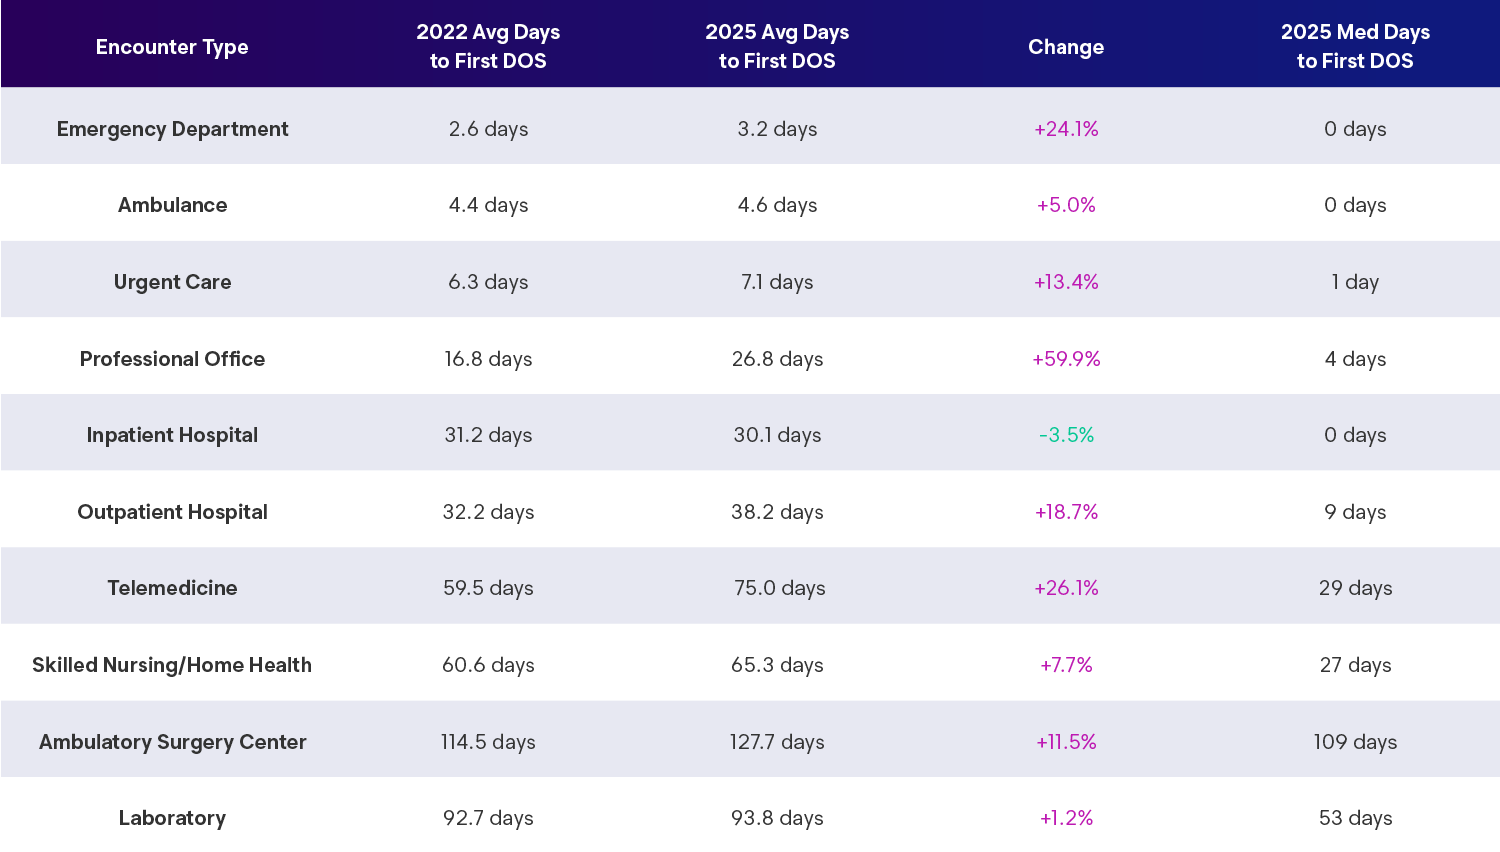
Average days to first date of service increased from 9.2 days in 2022 to 16.1 days in 2025, while the median remained constant at one day throughout the period. This contrast indicates two distinct claimant populations:
- Immediate-access claimants, typically entering care through emergency departments, urgent care, or employer-directed pathways, and
- Scheduled-care claimants, whose first professional office or specialty encounter occurs weeks after the date of injury
This divergence is particularly relevant for professional office settings, where average time to first service rose nearly 60%. These encounters represent the majority of workers’ compensation treatment and are most sensitive to provider availability, scheduling delays, network design, and first notice of loss timing.
Given the absence of recent national studies on workers’ compensation treatment delay, these findings offer timely insight into evolving access dynamics and merit further segmentation by state, network participation, and encounter type.
Insight
Delays in care have clinical implications. Research shows treatment delays beyond 7 days correlate with worse outcomes, extended disability durations, and higher total costs.
Treatment Duration and Episode Structure
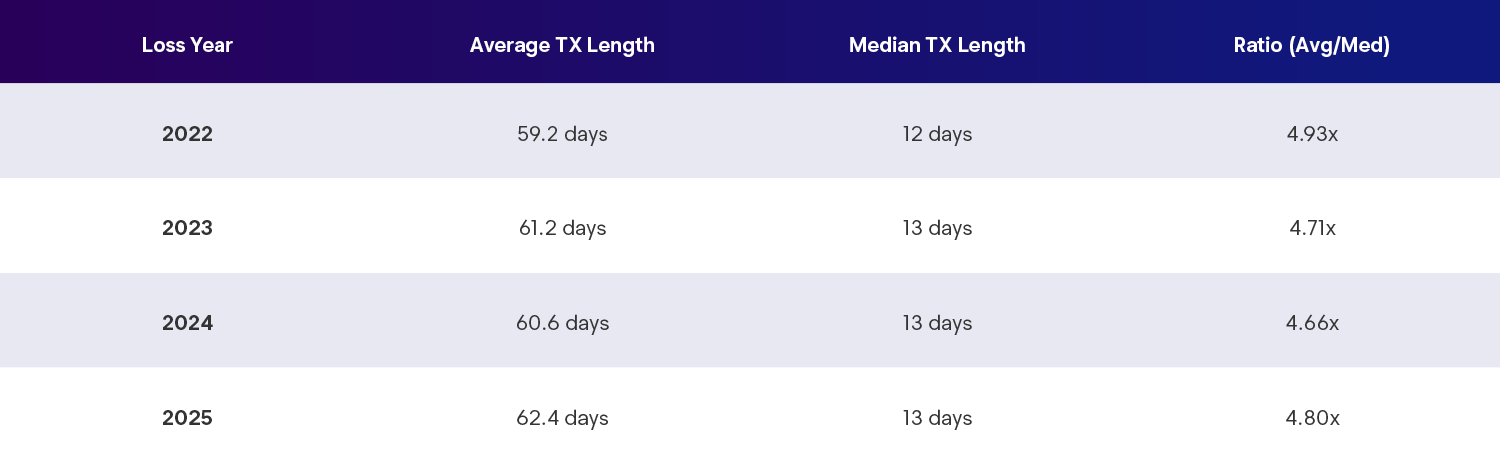
Average treatment duration increased from 59.2 days to 62.4 days between 2022 and 2025, while the median remained relatively stable. This parallel movement suggests that episode management remains intact overall, even as service intensity increases.
Insight
The pattern is consistent with care models emphasizing conservative treatment pathways, particularly for musculoskeletal conditions, rather than prolonged disability or runaway treatment courses.
Encounter Patterns: Where Workers Seek Care
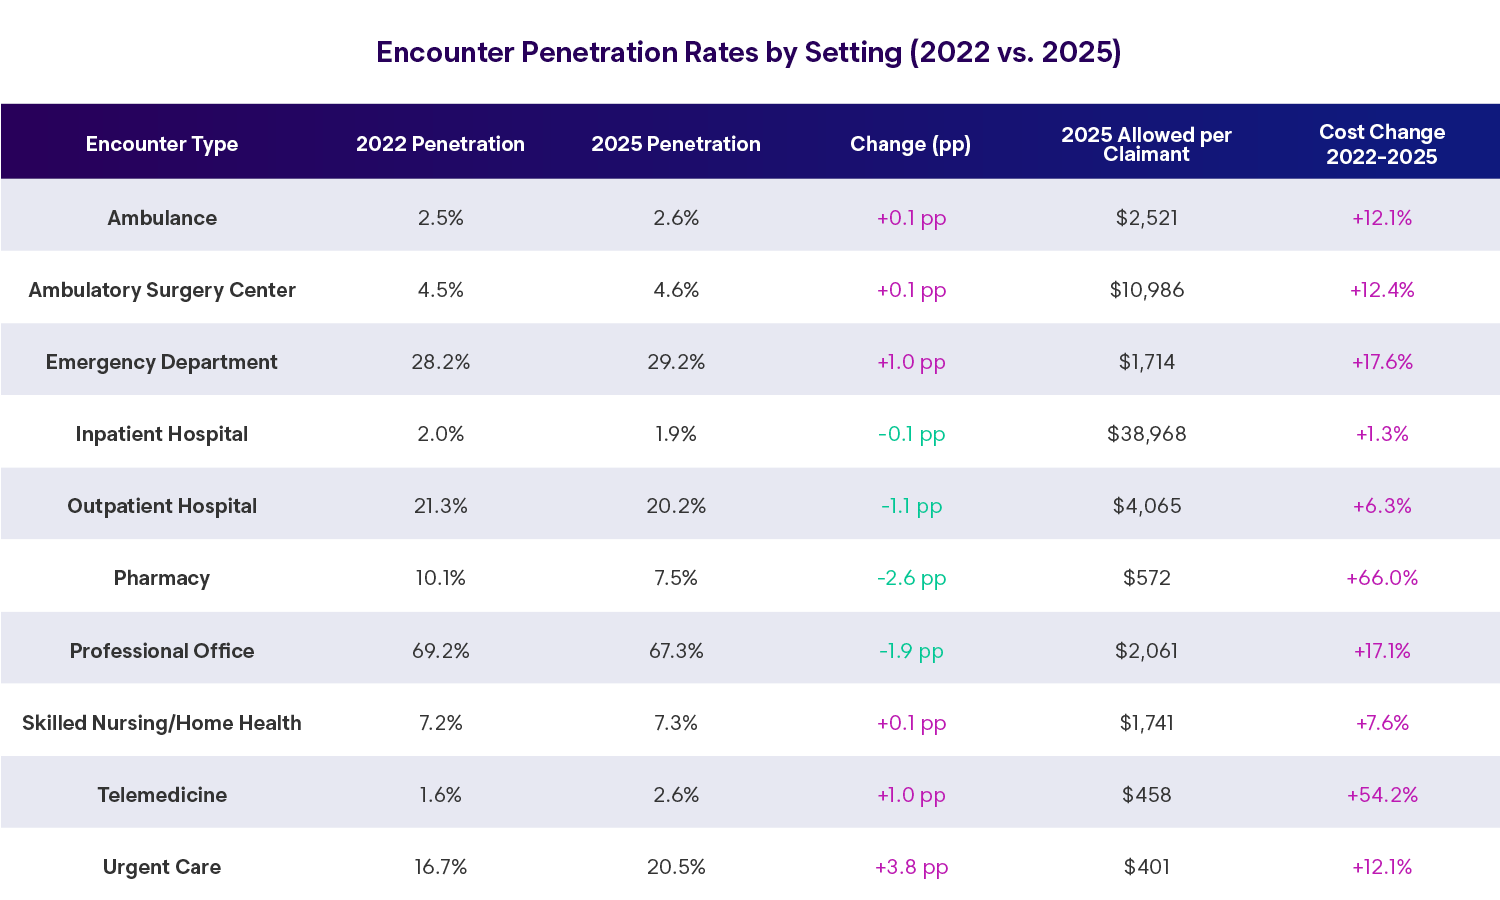
Care continues to initiate primarily in professional office, emergency department, and urgent care settings, though notable shifts are occurring:
- Urgent care penetration increased, now treating more than one in five injured workers
- Professional office utilization declined modestly, while allowed cost per claimant increased
- Telemedicine use grew, though it remains a small share of total encounters relative to regulatory focus
InsightS
- The growth of urgent care likely reflects a combination of convenience, extended hours, and difficulty securing timely appointments in traditional provider settings. Telemedicine expansion appears incremental rather than transformative, suggesting its role remains adjunctive rather than foundational.
- Pharmacy utilization declined, yet costs per claimant receiving prescriptions increased substantially, indicating a shift toward higher-cost or specialty medications among a smaller population of claimants.
Treatment Access by Setting: Days to First Service
Insight
The bimodal distribution is stark. Acute settings (ED, ambulance, urgent care) provide immediate access (0-7 days), while scheduled/specialty services show substantial delays. The 59.9% increase in professional office access time is particularly concerning given its 67.3% penetration rate — this affects two-thirds of all injured workers.
Injury Mix
Musculoskeletal Dominance Continues
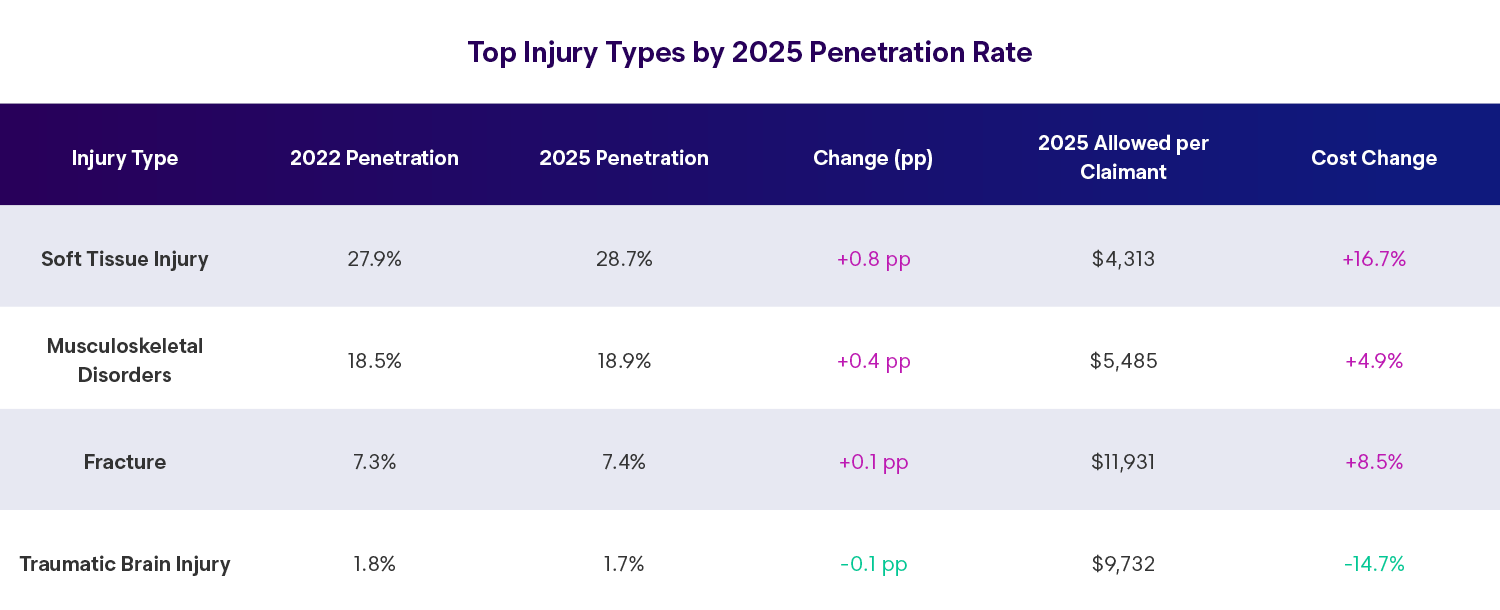
Musculoskeletal and soft tissue injuries accounted for nearly half of all claims in 2025. Growth in this category outpaced other injury types, reflecting:
- Workforce aging and degenerative conditions complicating recovery
- Greater diagnostic specificity over the life of the claim
- Occupational shifts toward physically demanding industries
- Emphasis on conservative treatment prior to invasive intervention
Despite their prevalence, musculoskeletal claims remain more sensitive to utilization management than unit pricing, reinforcing the importance of evidence-based treatment guidelines and clinical oversight.
Service Mix: High Utilization vs. High Severity
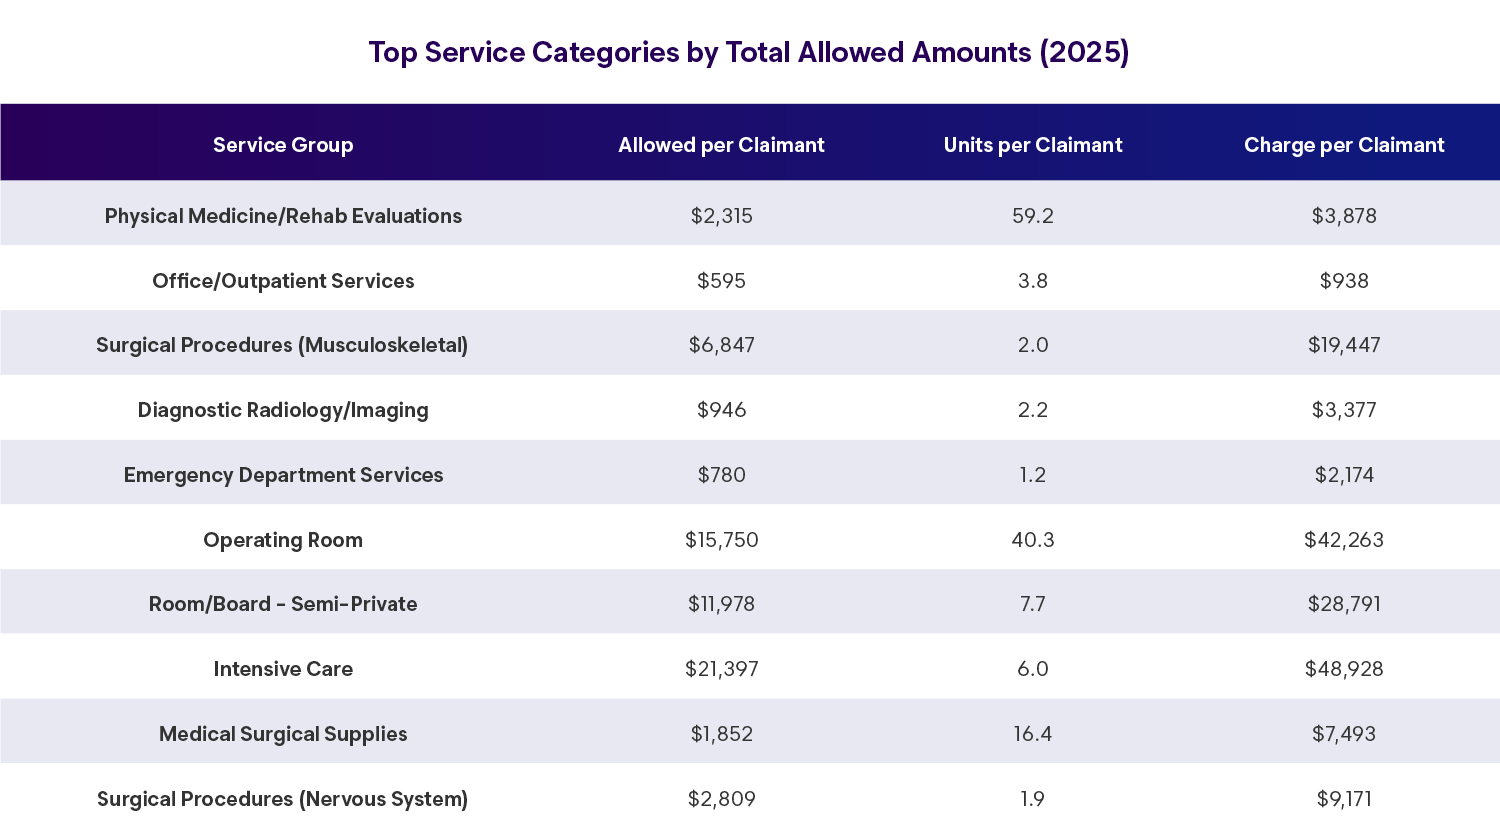
Physical medicine and rehabilitation services represent the largest share of total allowed dollars, driven by high frequency rather than high unit cost. In contrast, inpatient, surgical, and intensive care services account for a disproportionate share of spend among a small subset of high-severity claims.
This dichotomy underscores the need for differentiated medical management strategies — population-level utilization controls for routine care and targeted case management for complex, high-cost cases.
State-Level Observations
The largest 10 states account for the majority of medical spend and exhibit wide variation in cost, utilization, and treatment duration. States with stringent fee schedules tend to exhibit lower allowed costs but longer treatment durations, while higher-cost states often deliver more concentrated care within shorter episodes.
InsightS
No single state model dominates. Instead, trade-offs between access, efficiency, and administrative controls define state performance.
Largest Workers’ Compensation Medical Markets
Hover over areas of the map to learn more.
Source: State Report, 2025 (Ranked by total allowed dollars)
The top 10 states reveal dramatic variation in cost structures despite similar injury patterns. California operates the lowest-cost model at $2,679 per claimant — less than half the top-10 average — through aggressive fee schedule controls and mandatory provider networks. This comes at a cost: California's 75.9-day average treatment length ranks second-longest among major states, potentially reflecting access barriers that extend care episodes.
Wisconsin and Missouri anchor the high-cost end at $7,268 and $7,084 per claimant respectively, yet achieve among the shortest treatment lengths (46.9 and 54.7 days). This suggests concentrated, high-intensity care delivery rather than prolonged low-intensity treatment — possibly reflecting different injury mixes or surgical rates.
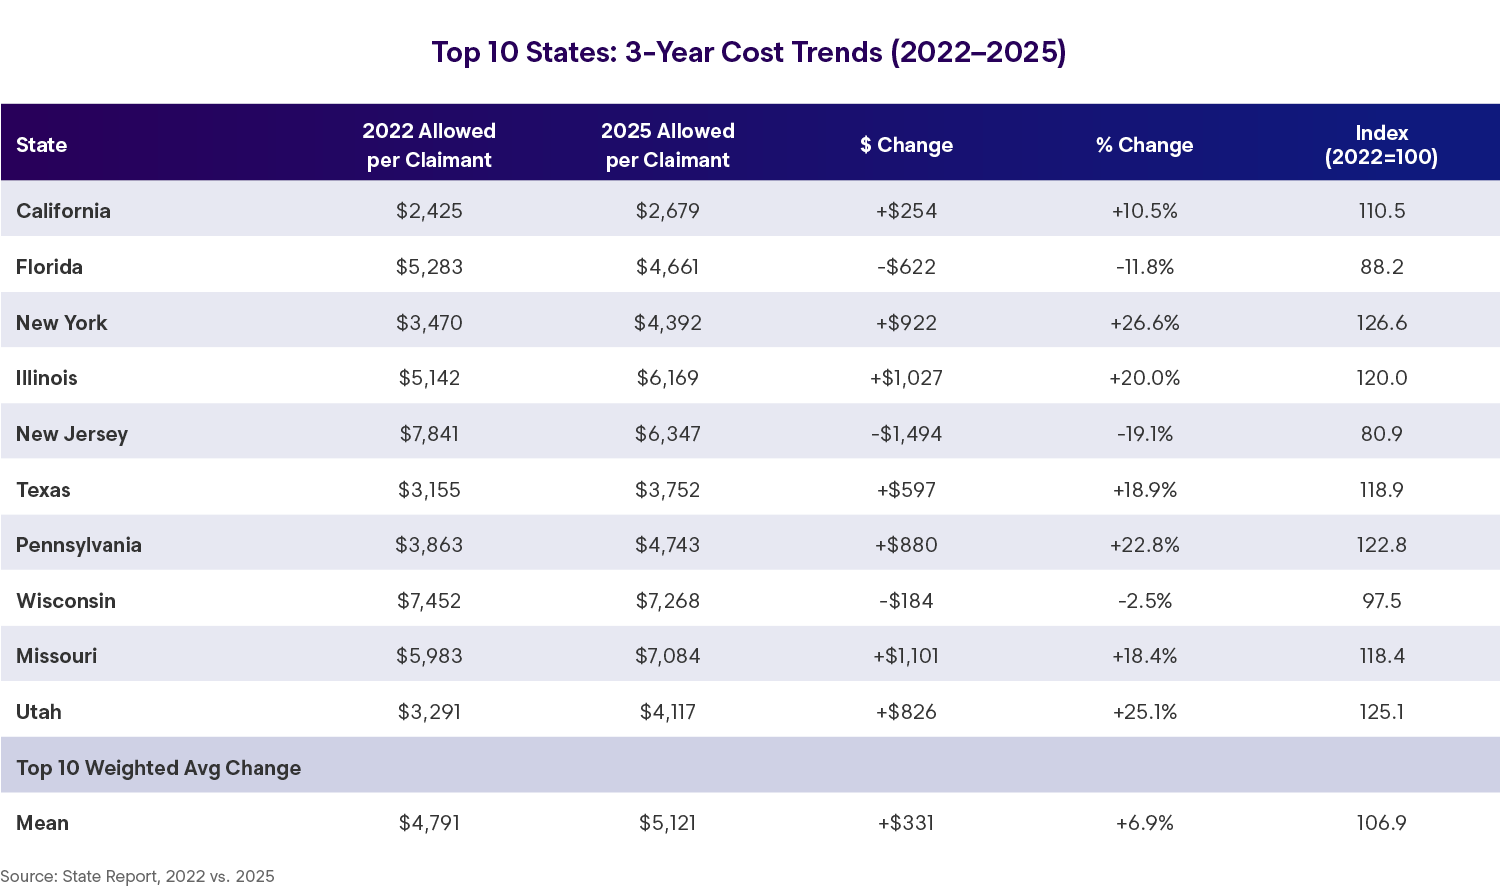
The top-10 states collectively experienced more moderate cost growth (+6.9%) than the national average (+9.5%), reflecting successful cost containment in key markets. Three of the ten largest states — Florida, New Jersey, and Wisconsin — achieved cost reductions over the period, demonstrating that high-volume markets can buck national trends through focused reform efforts.
New York's 26.6% cost increase stands as the most concerning outlier among major states, jumping from $3,470 to $4,392 per claimant. This surge coincided with the state's 113.7-day average treatment length — nearly double the top-10 average — suggesting systemic care delivery fragmentation or regulatory barriers delaying claim closure.
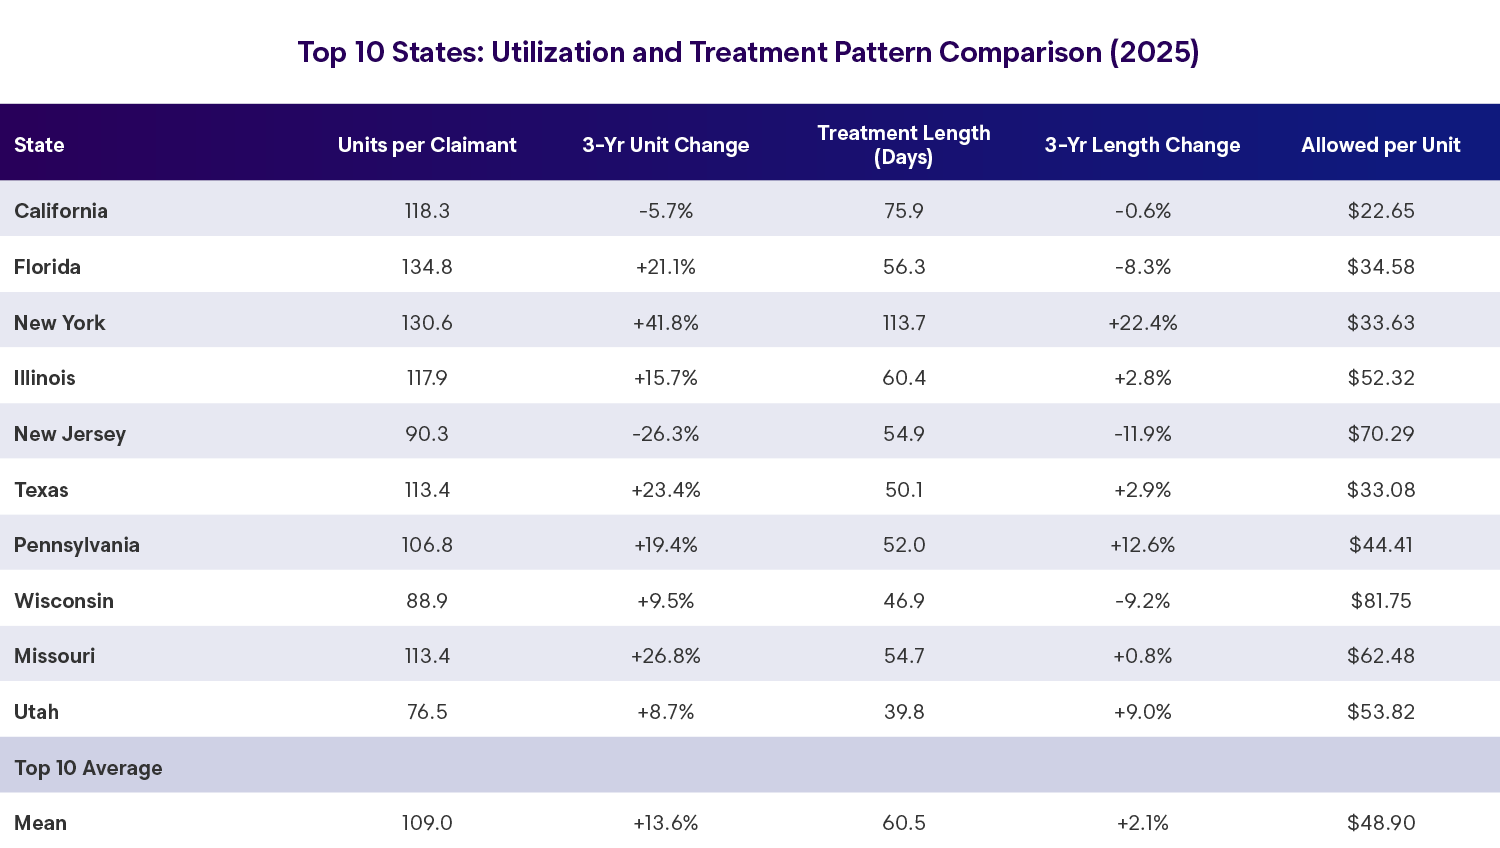
New York's utilization increase — units per claimant surging 41.8% from 2022 to 2025 — represents the most dramatic shift among major states. Combined with the 22.4% increase in treatment length, this suggests either a fundamental change in injury severity/mix or systemic barriers preventing efficient care delivery and claim resolution.
New Jersey's utilization management success provides a counterpoint: units per claimant dropped 26.3% while treatment length declined 11.9%, yet allowed per unit increased to $70.29 — suggesting a strategic shift toward fewer, higher-value services rather than volume-driven care.
Looking Ahead
As the workers’ compensation system moves into 2026, several themes warrant continued attention:
- Utilization intensity as the primary cost driver
- Access to scheduled care and the timing of treatment initiation
- Network performance and negotiated savings beyond statutory fee schedules
- Workforce demographics and evolving injury profiles
Overall, the data suggests a system that remains stable in frequency but increasingly complex in care delivery. Organizations that focus on care coordination, early access, and disciplined utilization management will be best positioned to manage medical severity while maintaining outcomes for injured workers.
Data Source: Industry aggregate workers’ compensation medical claims data, loss years 2022-2025, analyzed April 2026. Data represents industry-wide benchmarks across all states, injury types, encounter settings, and service categories. Individual payer or employer results may vary based on specific population characteristics, benefit structures, and medical management programs.