


Michele Hibbert
Senior Vice President, Regulatory Compliance Management

Ed Olsen
Director, Claims Performance Consulting, CPCU
Executive Summary
First-party automobile medical claims reflect a market that is beginning to demonstrate measurable cost discipline after several years of steady severity growth. Following increases in allowed medical cost per claimant from 2022 through 2024, the 2025 loss year marks the first year-over-year decline in allowed cost per claimant, decreasing 0.6% from the prior year.
This shift did not occur in isolation. It coincides with a sustained compression in treatment duration, particularly among typical claimants, while unit pricing pressures continued. The data suggests that recent utilization management and claim-handling strategies are influencing overall severity, even as provider charges and allowed amounts per unit remain elevated.
The defining dynamic in first-party auto medical claims is not claim frequency, but the interaction between treatment duration, service volume, and unit pricing, all operating within benefit structures that materially influence outcomes across states.
Industry Benchmarks and Four-Year Trends: The 2024 Cost Management Inflection Point
Loss Years 2022–2025 | Industry Aggregate Analysis | April 2026
Market Overview: Cost Stabilization Amid Pricing Pressure
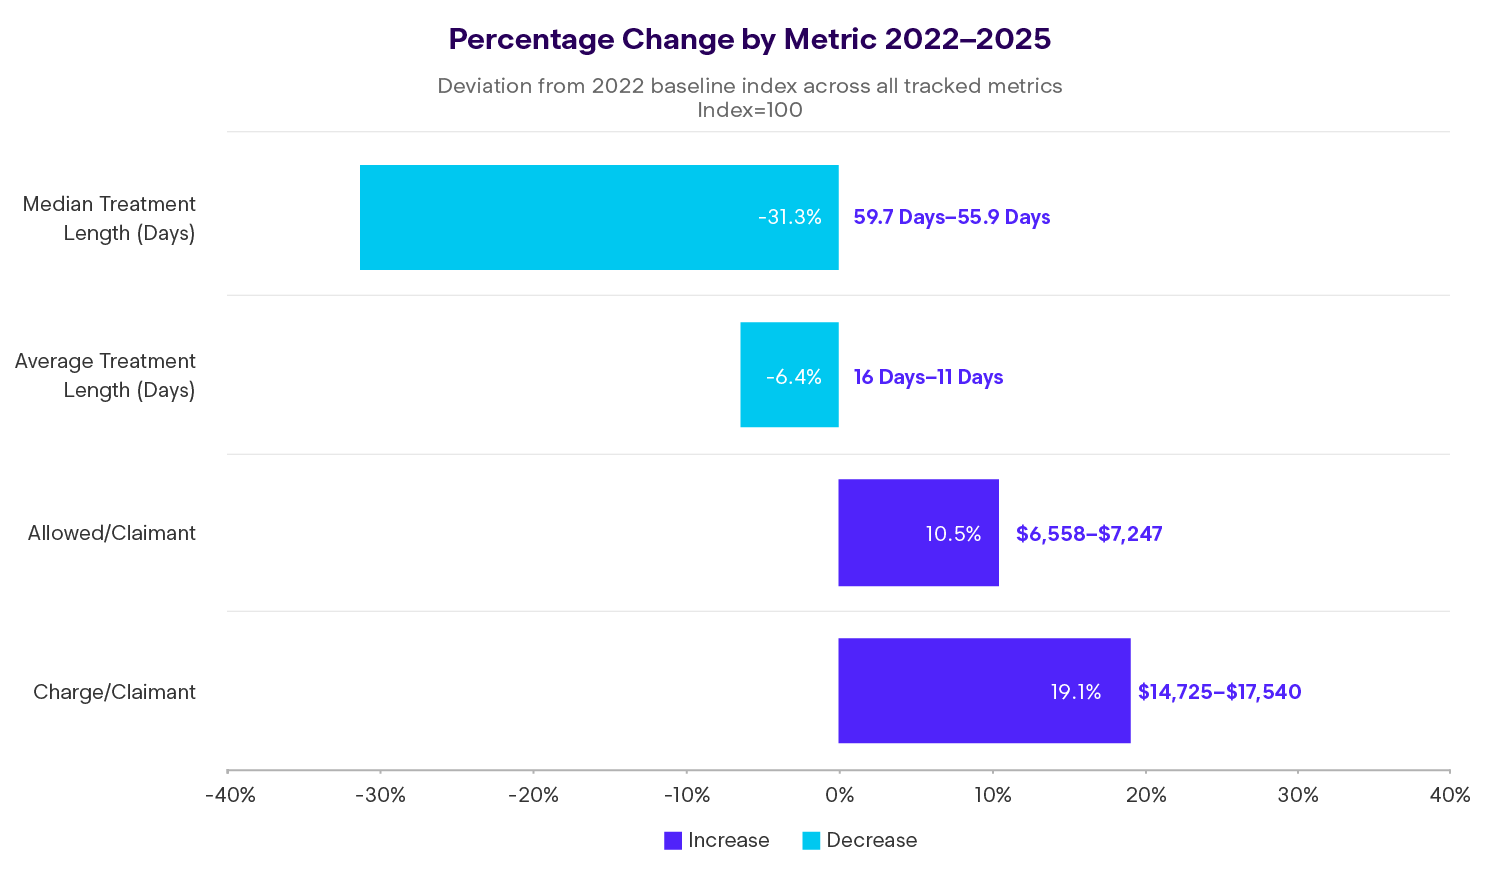
Allowed first-party medical cost per claimant increased steadily from 2022 through 2024, peaking at an index value of 111.2 before declining modestly to 110.5 in 2025. This represents the first year-over-year reduction in allowed severity during the period, despite continued growth in charges per claimant, which increased 19.1% from 2022 to 2025.
The disconnect between rising charges and stabilizing allowed amounts reflects the cumulative impact of utilization controls and treatment duration management. Average treatment length declined 6.4% over four years, while median treatment length compressed by 31.3%, signaling meaningful change in how quickly the majority of claims resolve.
Cost Drivers: A Units and Price Perspective
Medical severity in first-party auto claims is best understood through two fundamental components: how many services claimants receive and how much each service costs.
From 2022 to 2025:
- Units per claimant declined 2.8%, indicating modest success in reducing service volume
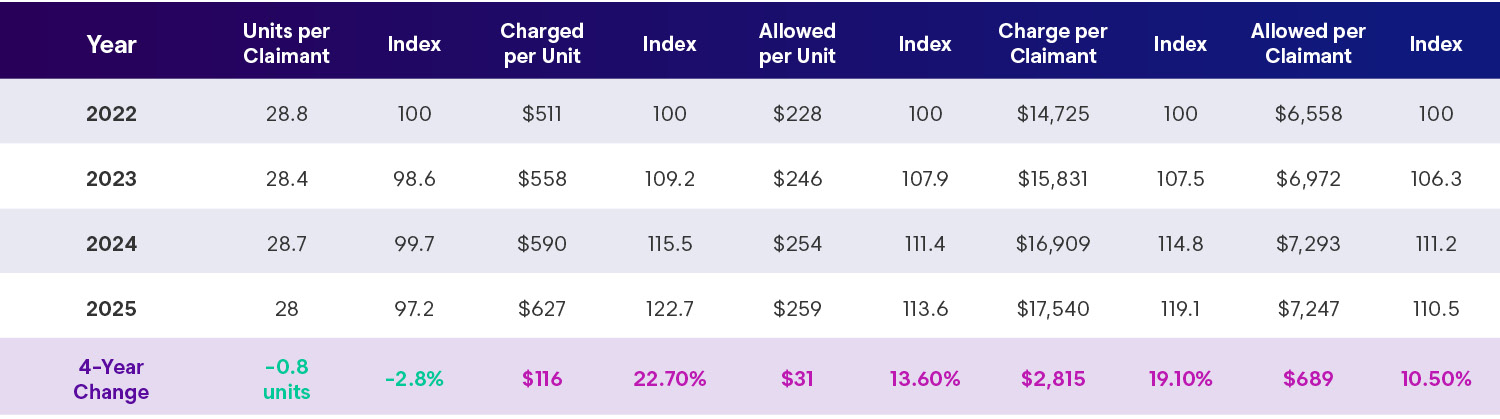
- Allowed cost per claimant rose 10.5%, driven primarily by unit pricing rather than utilization
Charged amounts per unit increased 22.7%, while allowed amounts per unit rose 13.6%, demonstrating significant provider pricing pressure that outweighed volume reductions. This pattern underscores a familiar challenge: utilization management initiatives can temper service counts, but unit price inflation — including negotiated rates — remains a dominant force in overall cost trends.
The widening gap between charged and allowed amounts indicates expanding discounts, yet rising absolute prices continue to push severity upward.
CRITICAL INSIGHT
Price Inflation Overwhelms Volume Reductions
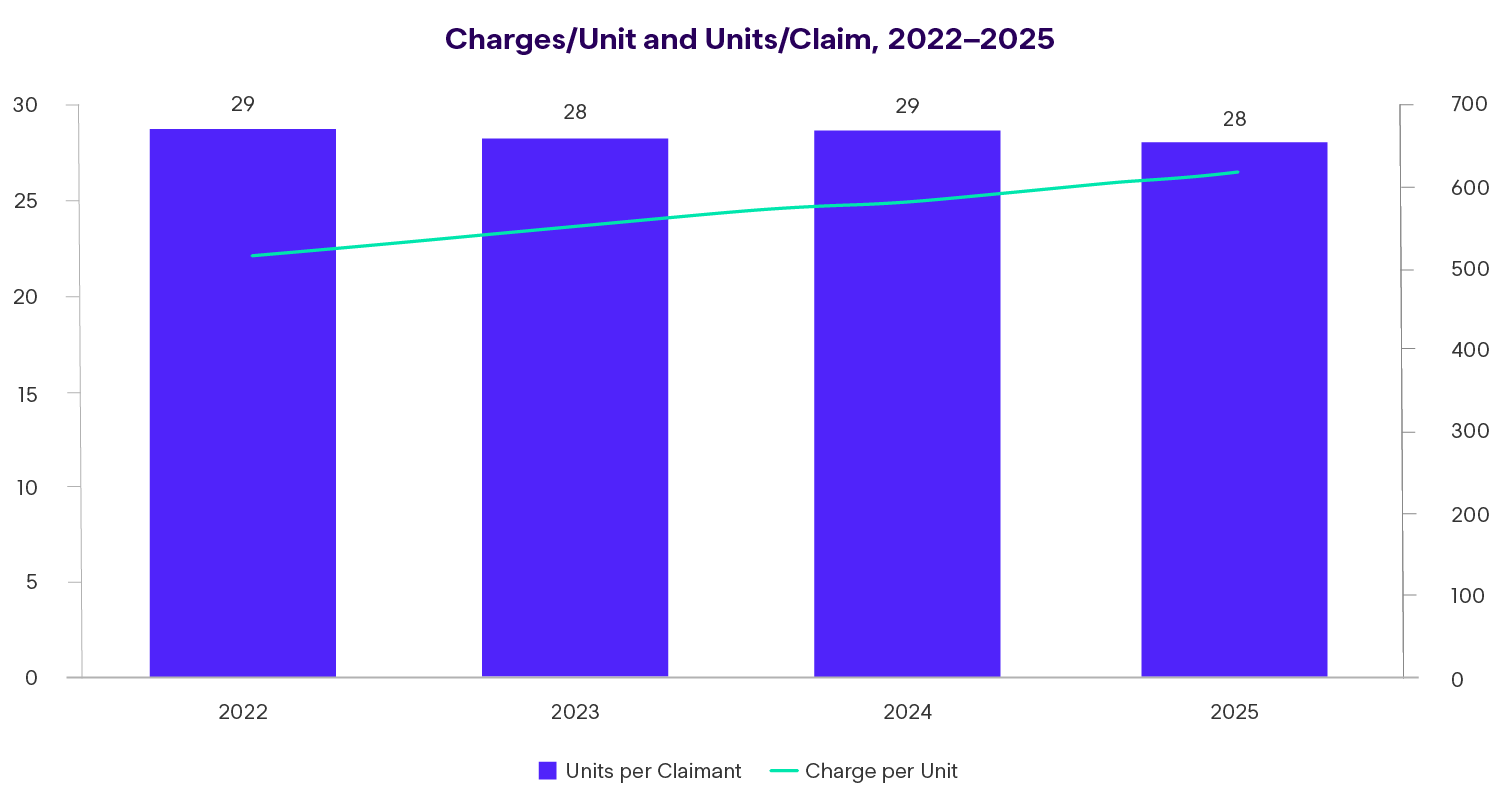
First-party claimants are receiving fewer services in 2025 (28.0 units per claimant) compared to 2022 (28.8 units) a 2.8% utilization reduction. Yet, costs per claimant increased 10.5% over the same period.
The culprit? Unit pricing. Charge per unit increased 22.7% and allowed per unit rose 13.6%. Every service from office visits to diagnostic imaging to therapy sessions became significantly more expensive, overwhelming the modest utilization reductions achieved through medical management.
This finding has profound implications: Utilization review programs are working to reduce service volumes, but provider pricing power is overwhelming these gains. Insurers must address both utilization AND unit pricing to achieve sustainable cost management.
The Discount Rate Squeeze
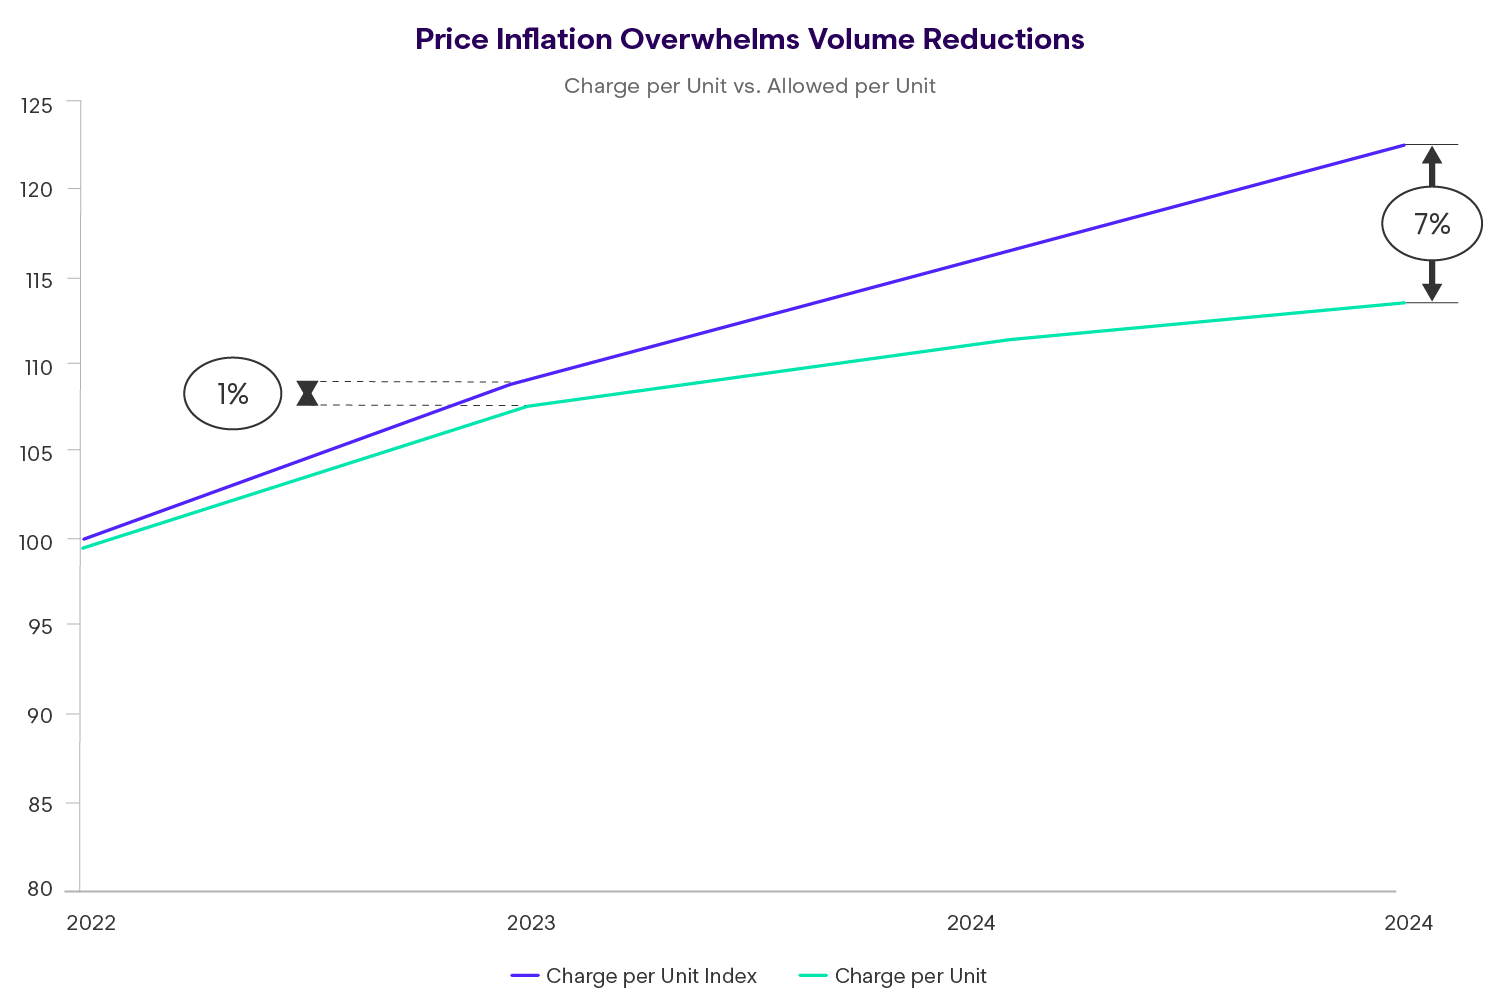
Notice the widening gap between charge per unit (+22.7%) and allowed per unit (+13.6%). This 9-point differential means providers are raising their billed charges much faster than insurers are increasing allowed amounts.
Insight
In 2022, insurers allowed an average of $44.50 for every $100 billed by providers. By 2025, that had fallen to $41.30 for every $100 billed, a 3.2 percentage point expansion in the discount rate. Despite the increasing discount on bill charges, allowed units per claim have been flat to slightly down reflecting strong utilization management.
Treatment Patterns
Compression Rather Than Expansion
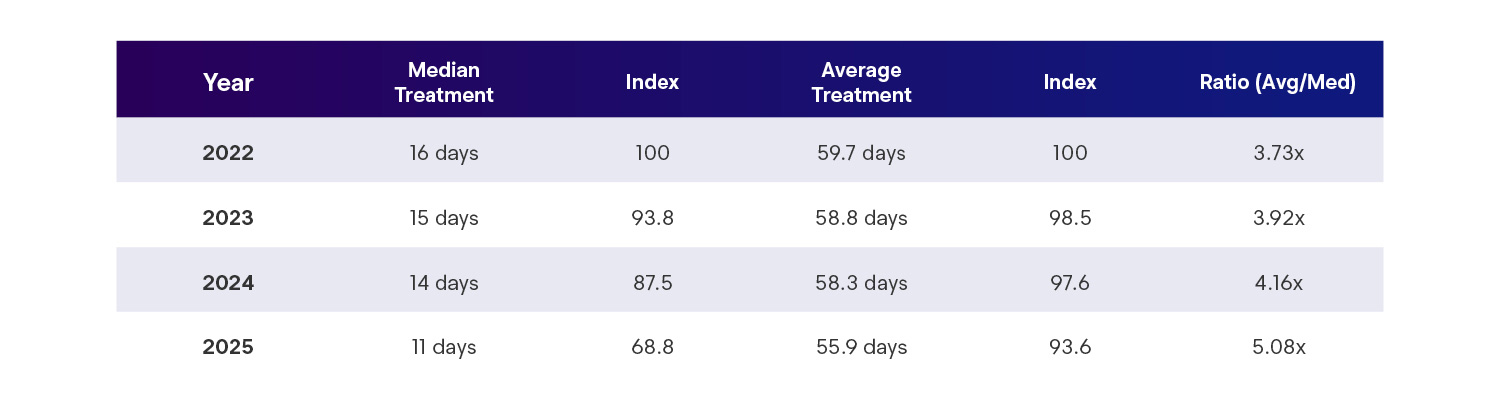
One of the most notable developments in first-party auto claims is the compression of treatment duration, particularly among typical claimants. Median treatment length declined from 16 days in 2022 to 11 days in 2025, while average treatment length declined more modestly, from 59.7 days to 55.9 days.
This growing divergence between median and average durations reflects a bifurcated claimant population:
- Short-duration claims, representing the majority of claimants, resolve quickly with limited intervention
- Extended-duration claims, comprising a smaller portion of claimants, require materially longer treatment episodes and account for a disproportionately large share of total medical cost
The implication is not uncontrolled treatment expansion, but rather a more concentrated severity tail that drives a significant share of spend. Effective medical management depends on recognizing these distinct populations and aligning resources accordingly.
A Tale of Two Populations
The divergence between median and average treatment length tells a powerful story about how first-party claims are bifurcating into distinct populations:
In 2022, the typical claimant (at the median) completed treatment in 16 days. By 2025, that same typical claimant finished in just 11 days, a 31% compression.
Yet, the average only declined from 59.7 to 55.9 days (6.4% reduction). The growing ratio (3.73x to 5.08x) reveals that first-party claims are bifurcating into two distinct populations:
The Bifurcation Effect
Population 1: Fast Resolvers
50%+ of claimants
Complete treatment in 11 days or less
These claimants have minor injuries (superficial contusions, minor soft tissue strains) that resolve quickly with minimal intervention
Population 2: Extended Treatment
~15-20% of claimants
Require 80-120+ days of treatment
These claimants have more significant injuries (fractures, severe soft tissue damage, musculoskeletal complications) requiring prolonged rehabilitation
Insight
Medical management strategies must be stratified. The majority of claimants need streamlined, low-touch authorization processes and self-service tools. The tail requires intensive case management, outcomes tracking, and regular medical necessity reviews.
Treatment Initiation: Rapid Access Maintained
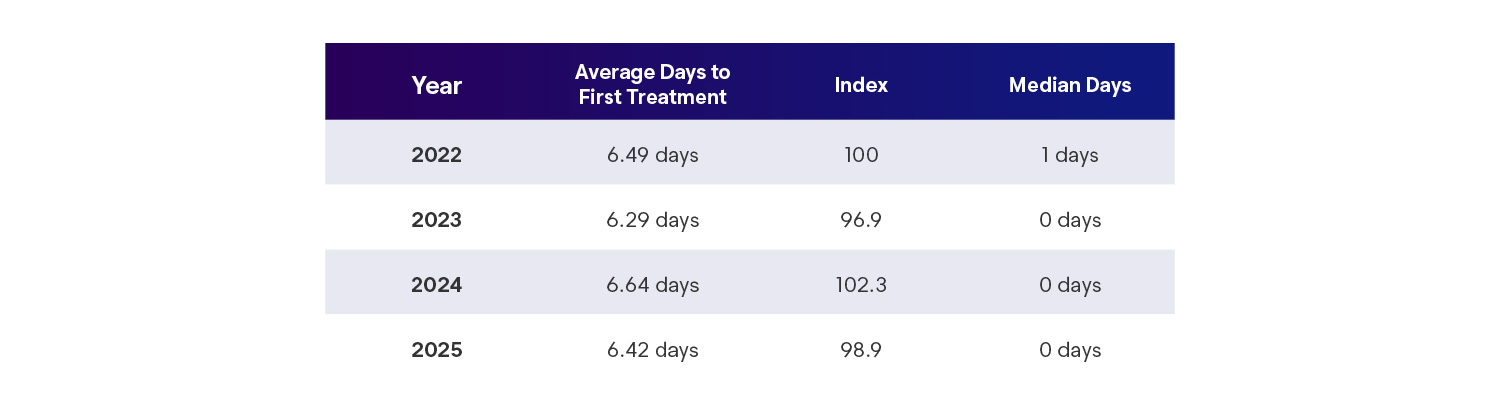
Access to initial treatment remains timely for most claimants. Median days to first service declined to same-day or next-day care in recent loss years, reflecting continued reliance on emergency departments and other immediate-access settings.
At the same time, average time to first service remains relatively stable, suggesting the persistent presence of delayed presenters who initiate treatment days or weeks after loss. These claimants represent a consistent subgroup rather than a growing access issue, and their outcomes may be influenced more by injury complexity and reporting behavior than by systemic access constraints.
Insight
The median dropping from 1 day to 0 days (same-day or next-day treatment) in 2023-2025 indicates more claimants are accessing immediate care, likely through emergency rooms (penetration grew from 47.5% to 50.6%). The stable 6-7 day average suggests delayed presenters those waiting several days or weeks before initiating treatment remain a consistent segment of the population.
Encounter Patterns: Site of Care Matters
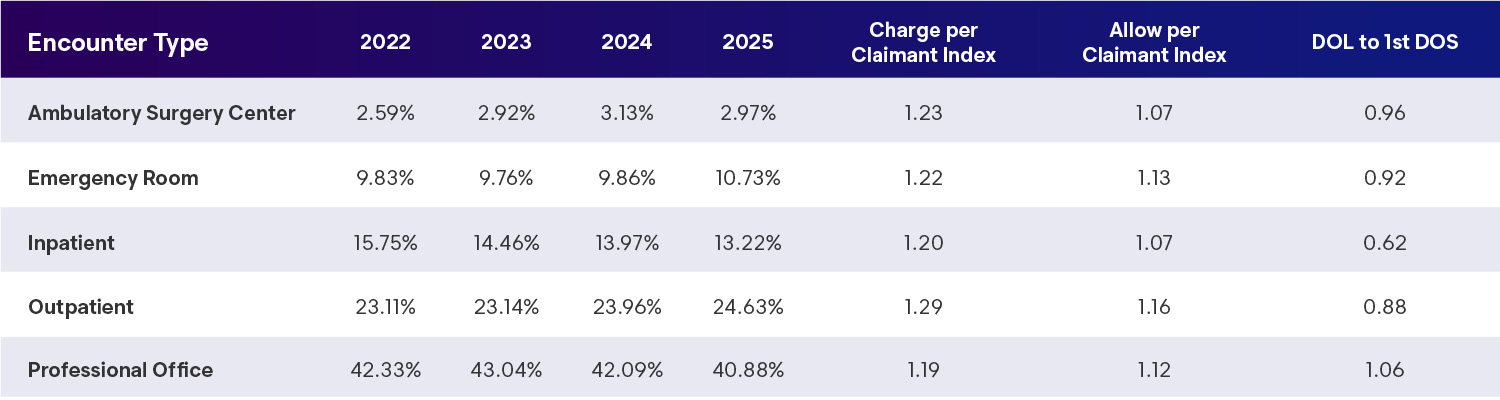
Emergency department and outpatient hospital settings account for an increasing share of allowed dollars in first-party auto claims. Since 2022:
- Emergency department allowed cost per claimant increased approximately 13%
- Outpatient hospital allowed costs increased approximately 16%
Insight
Both settings also experienced shorter average time from loss to first service. These trends suggest faster initial engagement with care, though often at higher unit prices, reinforcing the importance of site-of-service management in controlling severity.
Injury Mix
Interpreting the Musculoskeletal Shift
Diagnosis patterns shifted materially over the four-year period, most notably through increased penetration of musculoskeletal disease and disorder codes alongside declines in traditional soft tissue injury coding.
This shift likely reflects a combination of factors rather than a single driver:
- More specific diagnostic coding practices
- Evolution of injuries into chronic musculoskeletal conditions over time
- Greater use of diagnostic imaging
- Coding patterns that support treatment authorization and reimbursement
Insight
Rather than drawing definitive conclusions, the data suggests the need for ongoing review of diagnosis changes at the claim level, ensuring alignment between clinical findings, imaging results, and billed conditions.
Experimental Treatment Trends Emerging Technologies, Services & Procedures
Used to track and evaluate new medical technologies:
- Temporary Reporting (XXXXT), five-year cycle of review for conversion into permanent reporting codes
- Do not guarantee reimbursement but allow for data collection, payer discretion.
- Encourages innovation
- Main use is research and clinical trial tracking
- ~250 Codes, 40 added for 2025
2025 Enlyte Data
- ~$400M in charges from new technologies
- 35% of charges ultimately allowed
- Top 5 represent 90% of total
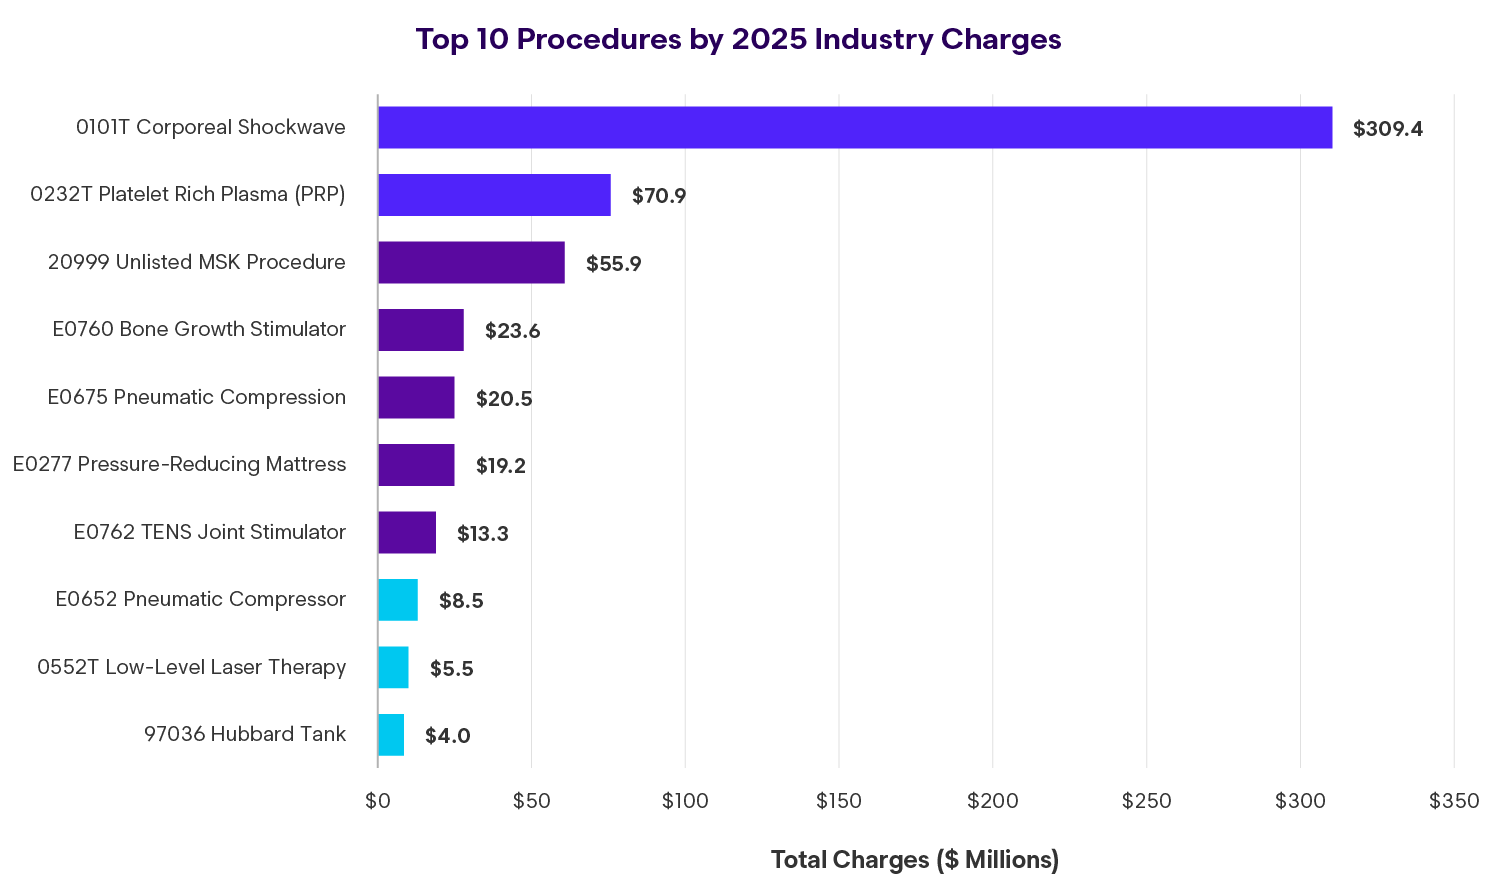
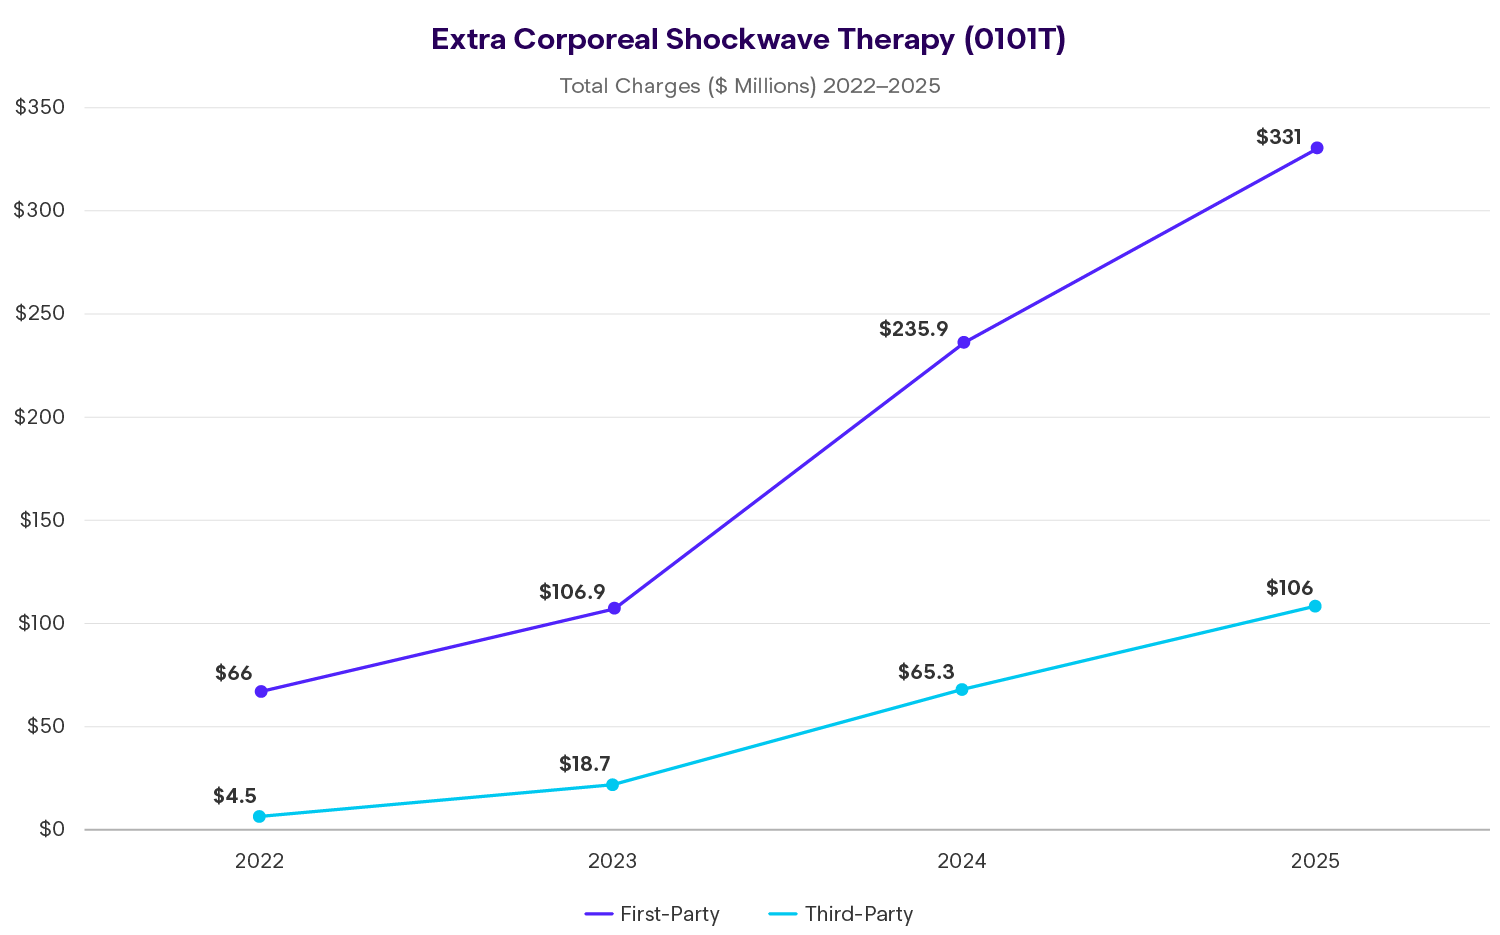
- 0101T – ECSWT – Extracorporeal Shockwave Therapy
- 0232T – PRP – Platelet Rich Plasma Injection
- 0552T – Low level laser therapy – thermokinetic
- 0275T – Percutaneous Laminotomy/laminectomy: lumbar
- 0219T – Placement intrafacet implant: cervical
- Florida represents largest state by volume
- FL, MI, CA, GA and NY comprise 92% of total
Emerging Code Landscape
Insight
0101T Extracorporeal Shock Wave alone accounts for 55% of all emerging code charges
The top 5 codes represent 87% of the total
+500% increase since 2022
Confounding Factors of Severity: Key Findings
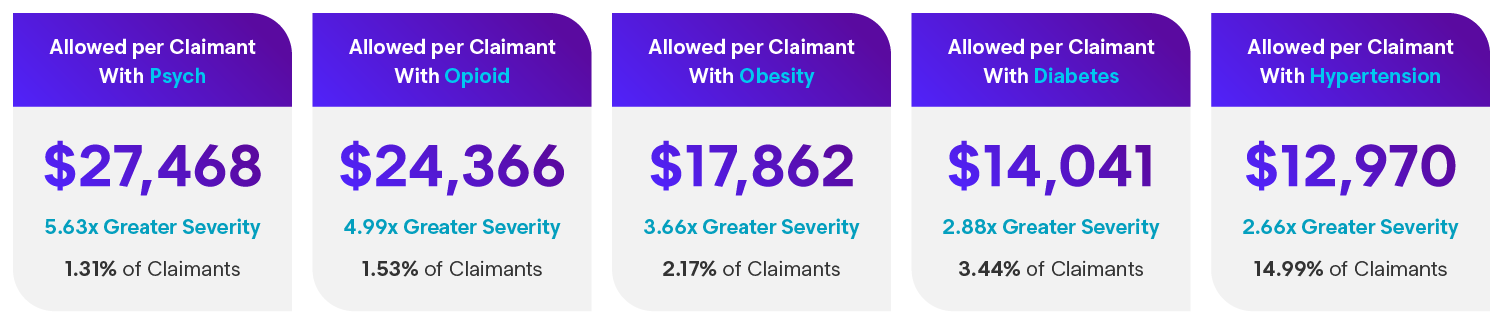
- Confounding factors disproportionately affecting total severity despite generally low frequency
- Even modest increases in frequency have a multiplier effect on overall allowed per claimant of entire book
- Behavioral health involvement has increased 15.3% since 2022, which adds 10% to total severity of all claims
- Patients with presence of confounding factors have ~50-100%+ more treatment days
- Cost of billed services themselves are not a significant driver of total severity (e.g., psych and opioids)
- Represents only 0.3%–2% of total allowed depending on category
- Increased costs through more care over longer duration, particularly on soft tissue/MSK claims
- Segmentation and application of evidence-based clinical carepaths to monitor each claim against expected recovery points with progressive claimant and provider engagement playbook based on risk levels
Geographic Variations
The Role of Regulatory Benefit Design
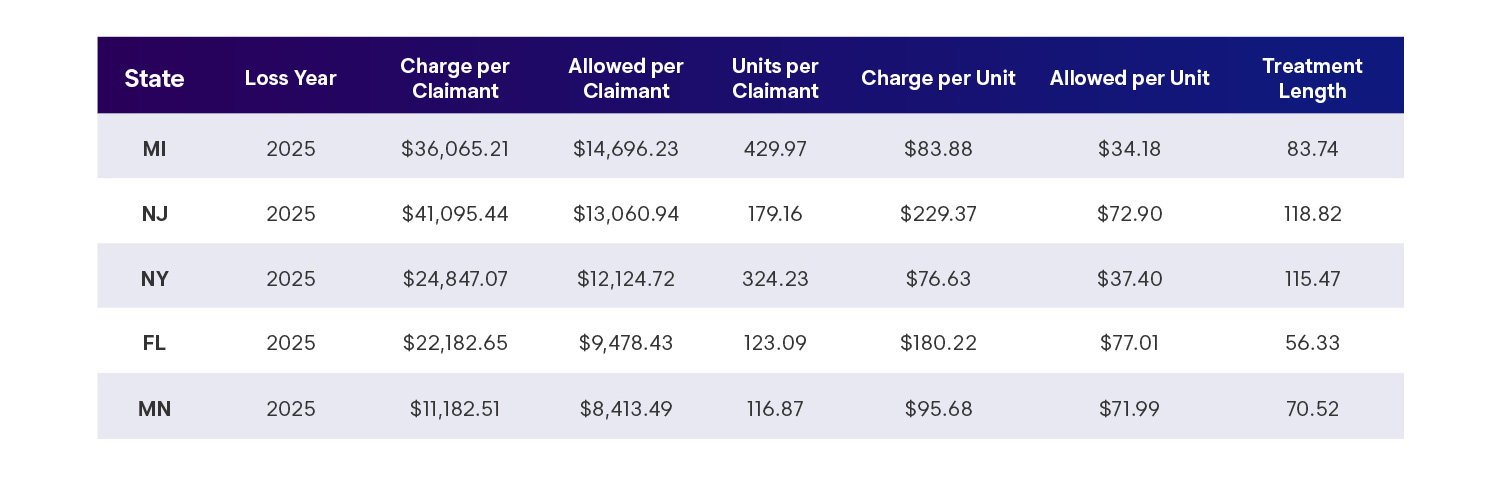
First-party auto medical costs vary widely by state, driven primarily by differences in personal injury protection (PIP) benefit structures. Cost per claimant ranged from approximately $2,400 to over $14,000, reflecting nearly a sixfold difference across jurisdictions.
States with high or unlimited PIP benefits consistently show higher medical severity, often accompanied by longer treatment durations. Conversely, states with defined benefit caps, fee schedule alignment, or workers’ compensation-based controls demonstrate materially lower costs per claimant.
Insight
These patterns highlight the outsized influence of statutory design on first-party medical outcomes, often outweighing utilization or injury mix differences alone.
State Cost Benchmarks (2025)
Looking Ahead
As the first-party auto medical landscape moves forward, several themes warrant continued attention:
- Unit pricing as the primary severity driver
- Continued management of treatment duration for typical claims
- Focused oversight of high-severity, extended-duration cases
- Ongoing evaluation of diagnosis shifts and coding practices
- Regulatory and benefit structure changes at the state level
Overall, the data reflects a market that is beginning to stabilize from a severity perspective, but remains highly sensitive to pricing dynamics and benefit design. Organizations that maintain discipline in utilization management while actively addressing unit-price drivers will be best positioned to sustain gains without compromising appropriate care.
Data Source: Industry aggregate first-party automobile medical claims data, loss years 2022–2025, analyzed April 2026. Results reflect aggregated experience and may vary based on state regulation, coverage structure, and claims management practices.