

Medical Cost and Inflation Trends: WC, First & Third Party Auto Claims

Michele Hibbert
Senior Vice President, Regulatory Compliance Management

Ed Olsen
Director, Claims Performance Consulting, CPCU
Medical Cost and Inflation Trends
As reported by the Bureau of Labor and Statistics (BLS) in July 2023, the consumer price index in United States rose by 3.2% over the preceding 12 months. The medical care index fell 0.2% in July, after being unchanged the previous month. The index for hospital services decreased 0.4% over the month, while the index for physicians' services rose 0.2%. The prescription drugs index was unchanged in July.
Enlyte analyzed our medical bill review charge data for trends and is providing our medical price index (MPI) specific to P&C claims. This information is based on our own observations of charges and trends. These observances are anchored in 2017 and we are providing our key findings and trends. This data covers the period Q1 2017 through the end of Q2 2023 by coverage.
Workers' Compensation Medical Price Index
Medical Inflation at the National Level
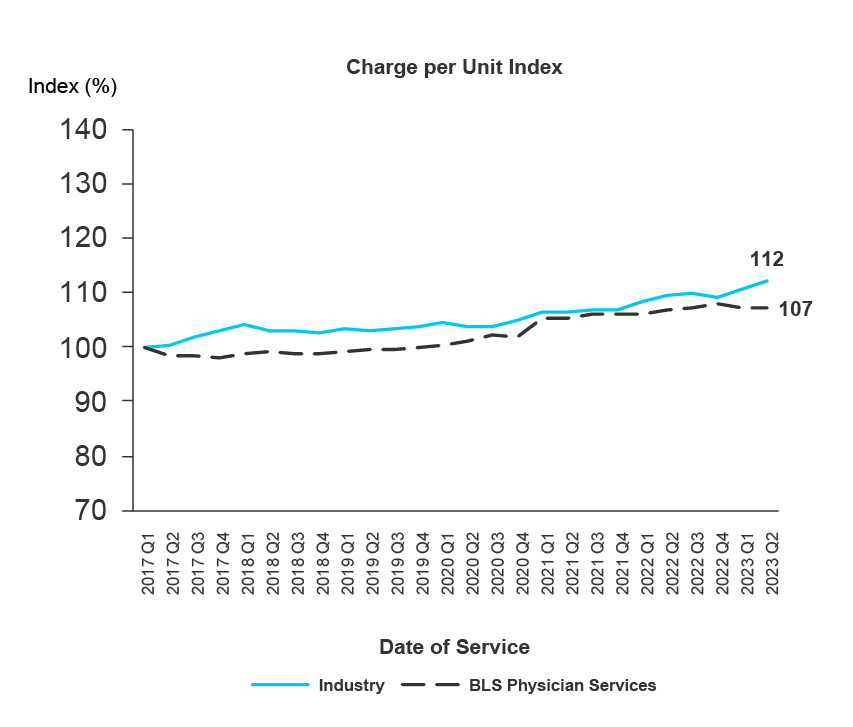
Since Q1 2017 physician charges per unit (or per procedure performed) increased by 12%. For physician charge services during the same timeframe, BLS Consumer Price Index (CPI) increased 7%.
Medical Inflation at the State Level
In workers' compensation claims, the high-volume states of New York, California, Florida and Texas provide noteworthy trends related to charges of medical services. New York, in particular, experienced changes related to implementation of the workers' compensation fee schedule fee schedule in 2019 and providers maximizing these rates in charge behavior.
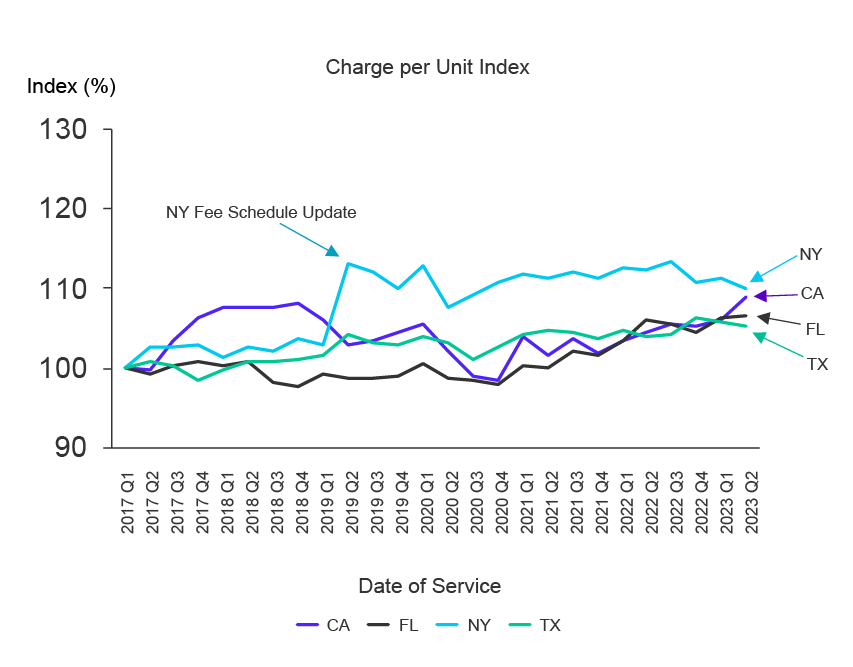
Between Q1 2017 and Q3 2023, New York demonstrated an 11% increase in charge per unit, while Florida experienced a 7% increase, California a 9% increase and Texas a 5% increase.
Auto First Party
Medical Inflation at the National Level
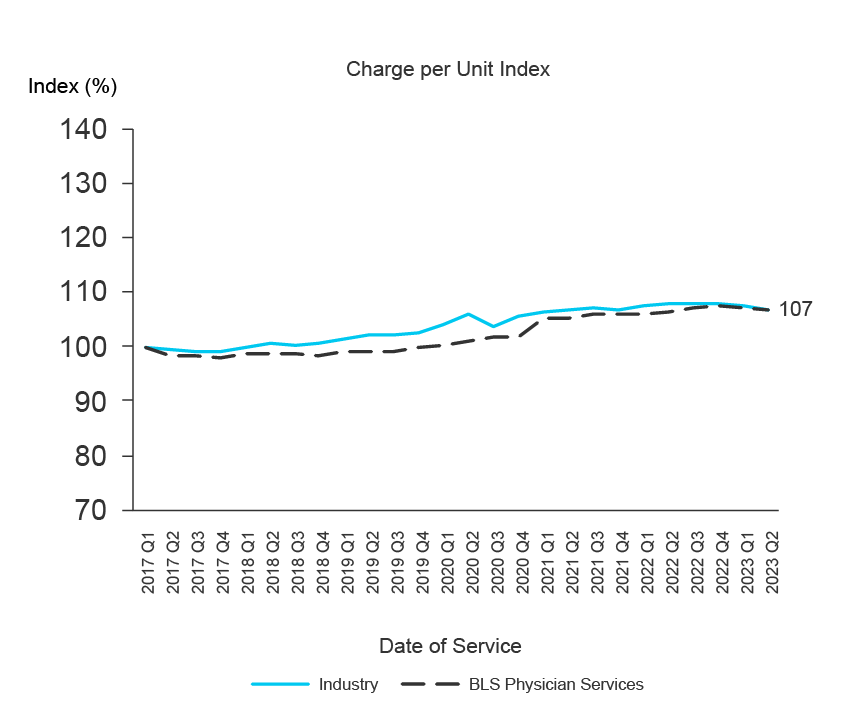
Taking a national view of provider charge data from Q1 2017 through Q2 2023 we observed a 7% increase in physician charges for first party claims. When we compare first party medical charges to the BLS CPI we see a similar charge trend of 7%.
Medical Inflation at the State Level
In first party claims the large volume states of New York, Michigan, New Jersey and Florida provide noteworthy changes in charge severity particularly in New York and Michigan where newer fee schedules have been adopted.
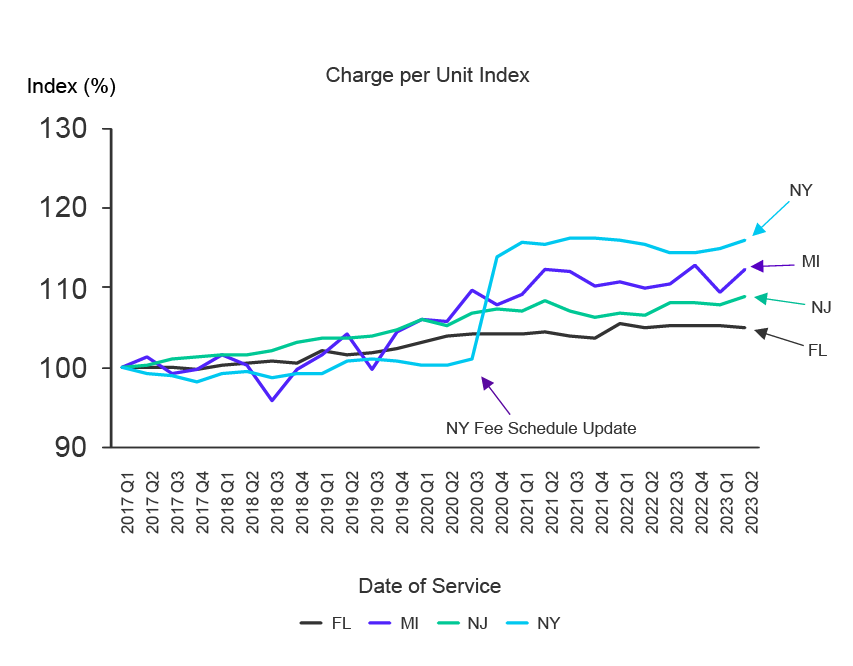
Between Q1 2017 and Q2 2023, New York demonstrated a 16% increase in charge per unit, while Florida has seen a 5% increase, New Jersey a 9% increase and Michigan a 12% increase.
Third Party Medical Price Index
Medical Inflation at the National Level
Third party claims are often “latent” when carriers receive them and may represent charges from more than a year earlier than observed in first party claims that are more real-time. Third party claims are also submitted on non-standardized forms, without appropriate billing codes and often in descriptions rather than actual invoices. Data capture practices and charge submissions are important drivers of charge observations in the third party claim.
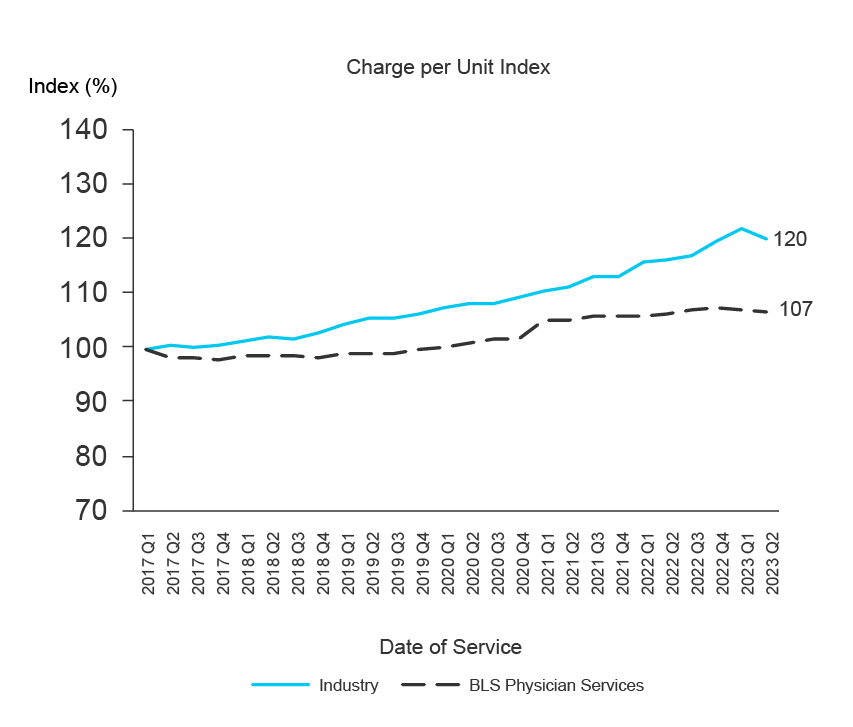
Since Q1 2017 physician charge per unit has increased in the third-party claim data by 20% and comparing the timeframe of Q1 2017 through Q2 2023 to the BLS CPI data of 7%, the differential in third party claim charges is 13% higher at the national level.
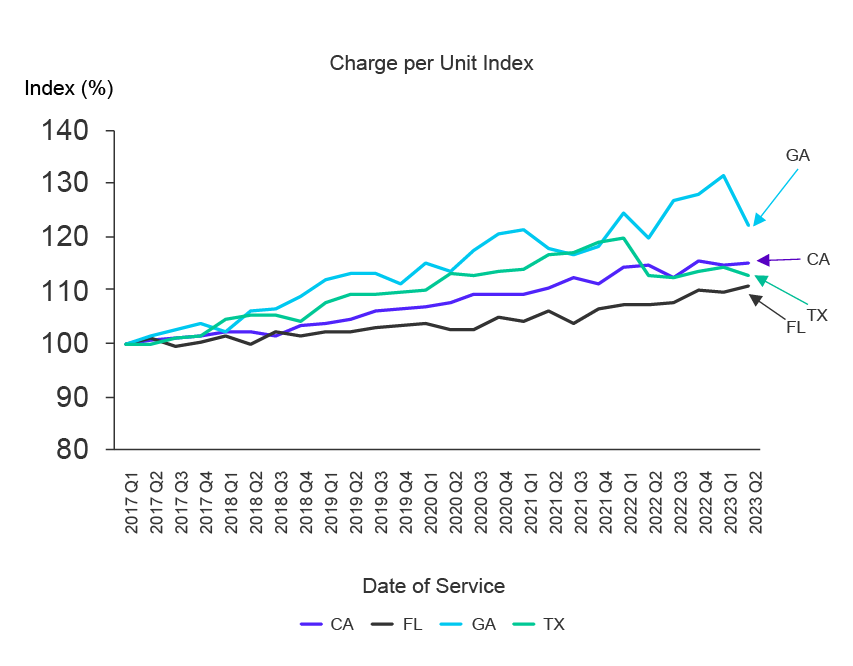
Medical Inflation at the State Level
Between Q1 2017 and Q2 2023, Georgia demonstrated a 22% increase in charge per unit, while Florida has seen an 11% increase, California a 15% increase and Texas a 12% increase.
Interested in learning about other trends?