

Macro Signals: Workers’ Compensation and Personal Auto

William Wilt
President, Assured Research
Workers’ Compensation: Another Good Year in 2025, but Pressure Often Follows
SIGNAL
Workers’ compensation continues to be a P&C success story, supported by sustained operational discipline rather than short‑term tailwinds.
Workers’ compensation represents a real success story for the P&C insurance industry
Figure 5 shows the century-to-date underwriting results on a calendar year basis. It’s notable that the combined ratio has been below 100% since 2015. Incredibly, the average combined ratio over the last five and 10 years has been around 90%.
At Assured Research, we’ve long thought that insurance professionals engaged in workers’ compensation deserve a hearty handshake and thank you. We believe that one of the significant contributors to the favorable underwriting results has been the industry’s long-standing effort to squeeze excess opioid prescriptions out of the system. Studies have long shown that workers’ compensation claims involving an opioid prescription involve longer duration and notably higher severity than similar claims using non-addictive pain medicines. Saving money is great, but our first thoughts are for the claimants, of course, whose chances of full rehabilitation are now much better than they might have been a decade or more ago.
But wait, there’s more. Smart claim triaging, robust return-to-work programs, and, of course, a safety-first mentality have also contributed to these strong results. And let us not forget that medical inflation, predicted by some to spike after passage of the Affordable Care Act (guilty as charged!) has remained relatively low and stable (exceptions surrounding the pandemic aside, and we are being careful to comment here on unit price inflation, not overall spending which also considers utilization). We are aware many workers’ compensation insurers regularly price and reserve on the expectation of a mid-single digit medical cost trend while low, often 2% or 3% trends have been realized. Add to that the long-standing gap between wage inflation and medical inflation and one can see the ingredients for strong results have been in place for many years.
Leadership Takeaways
- WC is a structural profitability leader, but tailwinds are shifting
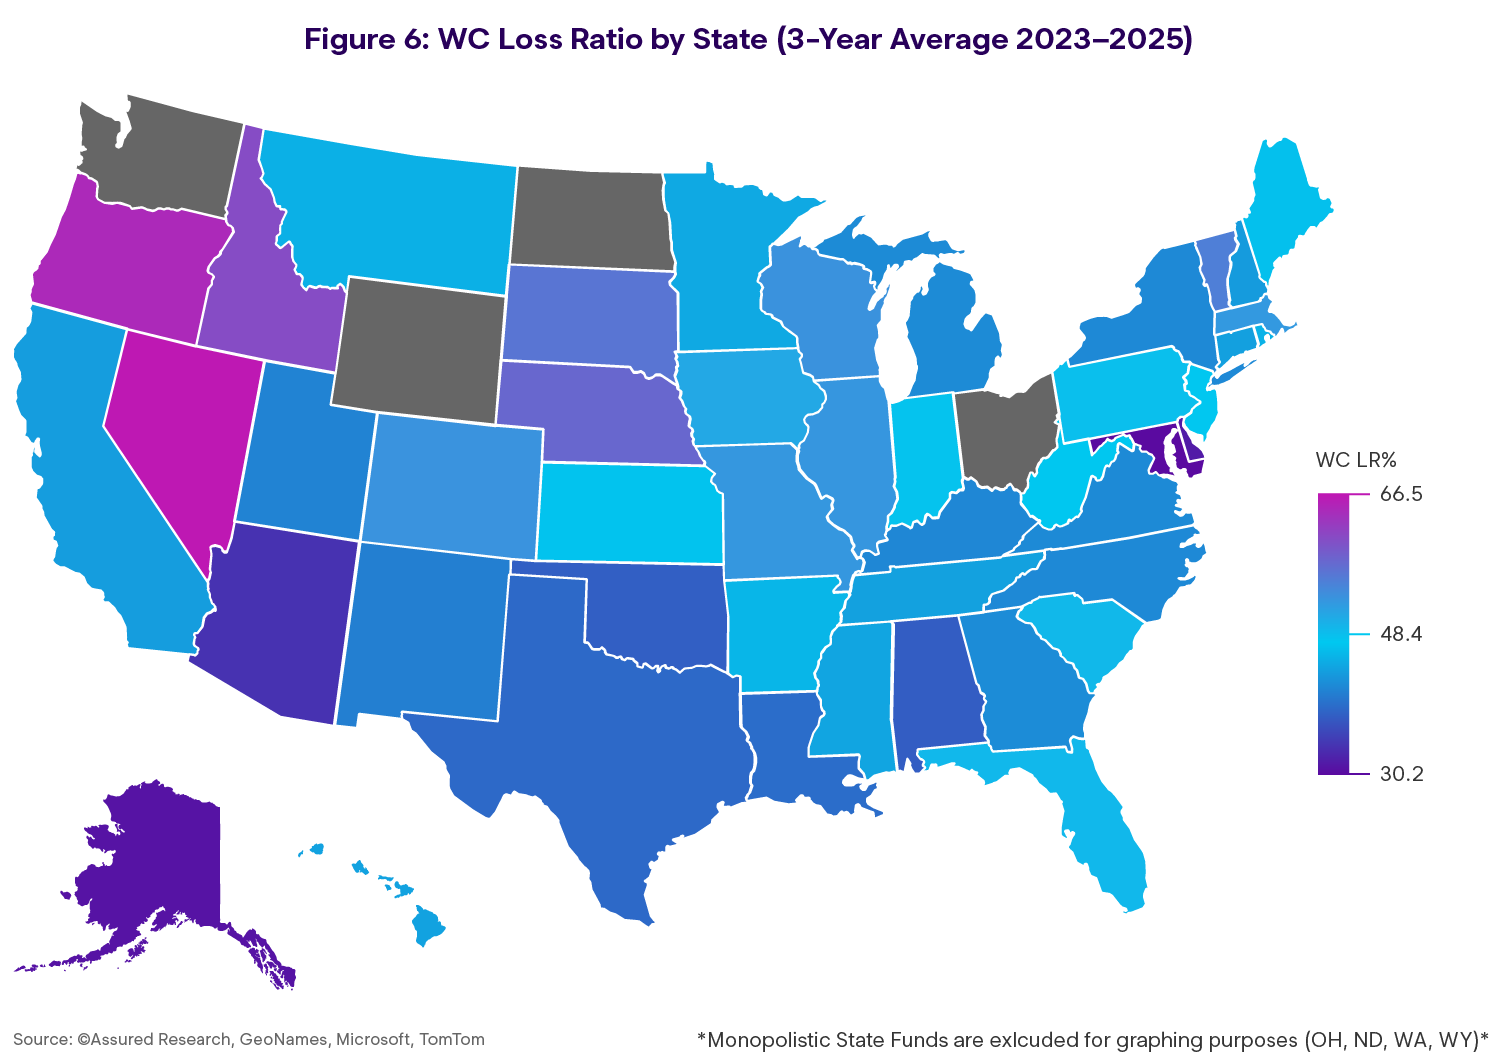
- State variation (Figure 6) reinforces the need for segment‑level interpretation
What to Watch
- Track state‑level loss ratio differences and shifts in medical + indemnity severity components
- Flag early changes in claim duration and RTW outcomes as leading indicators
But … Nothing Lasts Forever. We Are Less Optimistic About 2H26 and 2027
We try not to be the glass-half-empty industry analysts who see risk around every corner, but we suspect even those bullish on workers’ compensation results will recognize this prolonged period of underwriting profitability is getting long in the tooth.
Here are some of the issues we are watching into the second half of 2026 and 2027.
Headwind 1: Wage vs. Medical Inflation Gap May Narrow
SIGNAL
The wage/medical inflation gap acts like an implicit rate increase when wage inflation exceeds medical inflation.
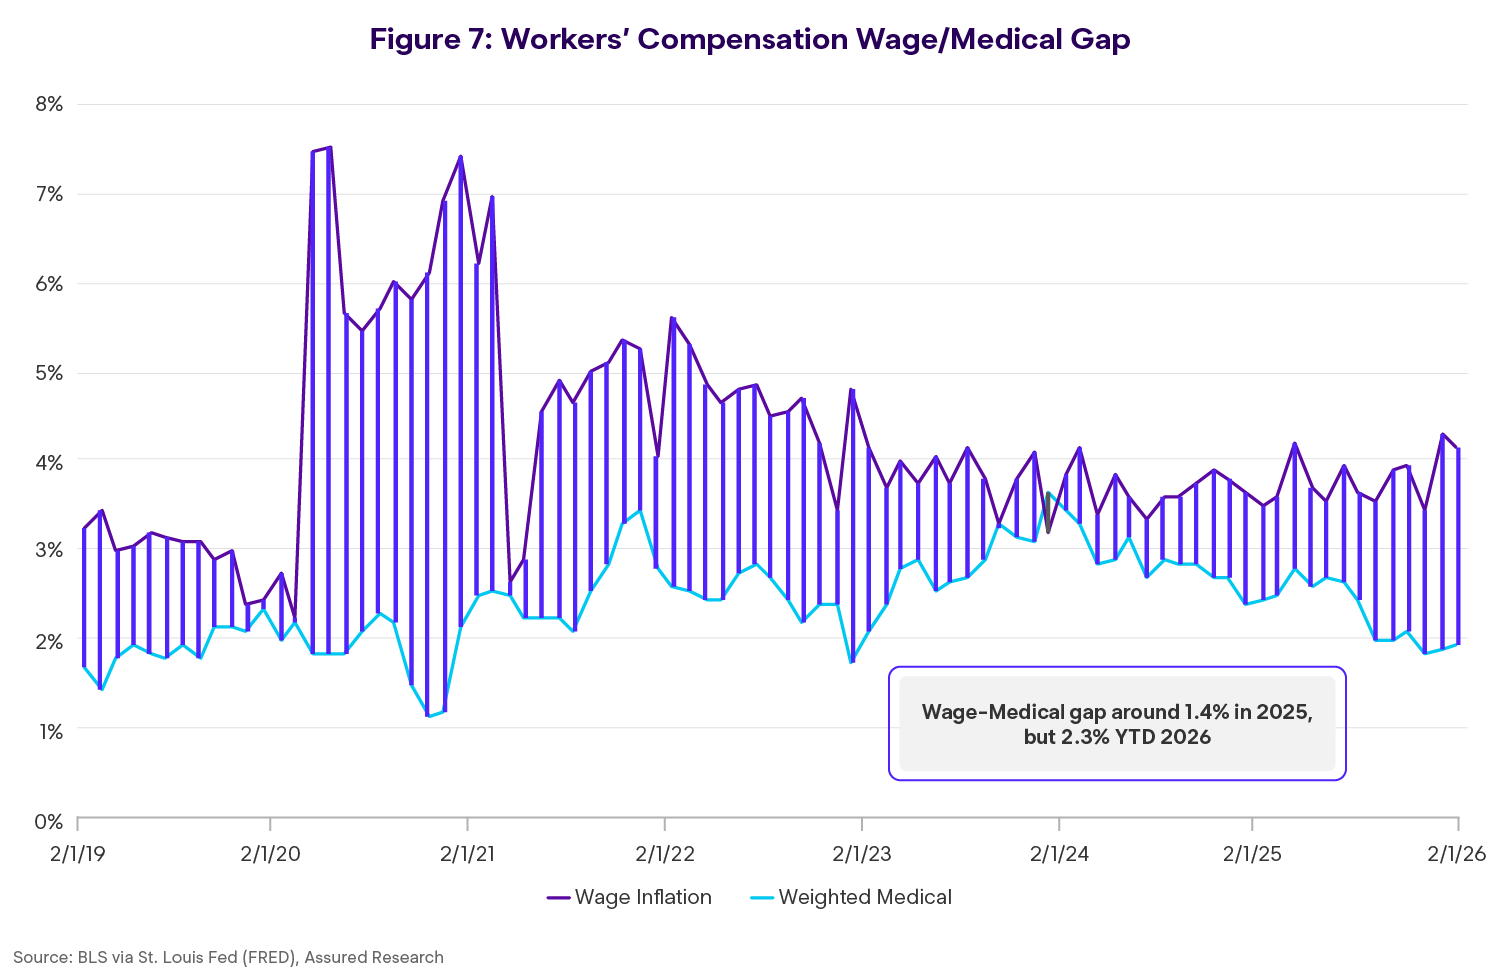
Medical inflation as measured for workers’ compensation insurers has been benign for years — typically in the 2-2.5% range thanks, in part, to a heavy weighting to the cost of physician services which has risen in the 1% to 2% range since passage of the Affordable Care Act. Moreover, as many will already know, when wage inflation runs ahead of medical cost inflation, the difference acts like an implicit rate increase for WC insurers since premiums naturally inflate with wages but some 60% of costs are tied to the lower medical cost increases. Figure 7 shows the wage/medical cost gap in the years immediately before and since the pandemic.
Our outlook for 2H26 and into 2027 is somewhat bearish, which is to say we think upward pressures on medical inflation will manifest while slack in the labor market will put downward pressure on wage growth. In fairness, we have been bearish on medical inflation since passage of the Affordable Care Act and clearly wrong for quite some time now. But to share our thinking on medical costs we feel the imbalance of supply (of health care professionals) and demand for health care as baby boomers age will fuel rising health care costs. And on the wage side of the equation, if concerns over the impact of AI disruption and an uneven economy manifest as some fear they could, then the labor market could weaken which should cool wage inflation. Putting these two pressures together, we think it more likely that the wage/medical inflation gap narrows in the months and quarters ahead. And if that happens while insurers are still in the habit of decreasing workers’ compensation rates, even in the low single digits, that years-long tailwind to the loss ratio will quickly turn into a headwind.
The good news we can share is this: even if we are right about these dynamics becoming a near-term headwind, actuaries in the workers’ compensation industry have proven to be adept at monitoring, measuring, and incorporating changes in inflation and the labor markets into their pricing algorithms. We do not anticipate longer term or structural pricing imbalances resulting from changes in medical or wage inflation.
Leadership Takeaways
- A narrowing gap can worsen WC results even without a spike in frequency
- Pricing habits formed in a favorable gap environment can become misaligned as conditions normalize
What to Watch
- Establish a watchlist: medical price trend + utilization, wage growth, and filed/approved rate movement
- Increase the cadence of monitoring during periods of declining WC rates
Headwind 2: OBBB Act and Cost-Shifting Risk
SIGNAL
Shifts in health coverage can change claim behavior and payer dynamics.
The One Big Beautiful Bill Act was signed into law July 4, 2025. Although the impacts are still unfolding, estimates made by the Congressional Budget Office in 2025 suggested some 11 million Americans could lose health coverage (with potentially five million more from the loss of ACA tax credits).
Consider a sprain, strain, or tear of uncertain origins. If an employee does not have health insurance or must meet a high deductible under a group health policy, they are more likely to report that as a job injury. Sprains, strains, and tears account for around 1/3 of WC claims and costs.
These are obviously long-term projections subject to much uncertainty, but if the projections are directionally correct, the risk, as we see it, is that the OBBB will lead to an increase in medically uninsured which, in turn, seems likely to increase the frequency of workers’ compensation claims for those working without medical insurance. Tempering this trend, to some degree, could be a rise in the employer-sponsored take-up rate of group health (GH) coverage. That take-up rate by employees had fallen around 10 points over the past few years as Medicaid expansion ramped up and ACA subsidies expanded. (Not surprising — people generally seek to maximize subsidies made available by the government.)
It is our view that changes catalyzed by the OBBB Act will, on the margin, make it more likely for injured workers to file WC claims. This will happen, we believe, under two scenarios: First, if an injured worker is without health care (e.g., loses Medicaid or an ACA plan because of the OBBB Act and/or personal choice) then he or she is more likely to file a WC claim in instances where treatment under the health plan might have otherwise been pursued.
In a second scenario, many workers losing Medicaid or ACA coverage will move back onto an employer-sponsored health care plan. And while WC claims behavior in this scenario is necessarily more nuanced, we believe (and research suggests) that some workers with soft tissue injuries, in particular, will present with a WC claim rather than a group health claim. Why? Nearly all GH coverages come with a sizable deductible while WC medical payments start at $1. Again, people are smart and naturally gravitate to the least-expensive medical option where differences in quality of or access to care are perceived as immaterial.
If we’re right about these trends, it is our sense insurers will begin to see signs of change in the claim data by the latter part of 2026 or early 2027. If nothing has materialized by that point, we will need to revisit our thesis.
Leadership Takeaways
- Coverage shifts can change claim mix and frequency even if workplace risk is stable
- Soft‑tissue injuries are a plausible early signal area
What to Watch
- Monitor soft‑tissue claim frequency and early medical utilization patterns for changes
- Compare WC vs. group health dynamics where employer plan deductibles are rising
Headwind 3: Labor Market Sensitivity (LLAER Risk)
SIGNAL
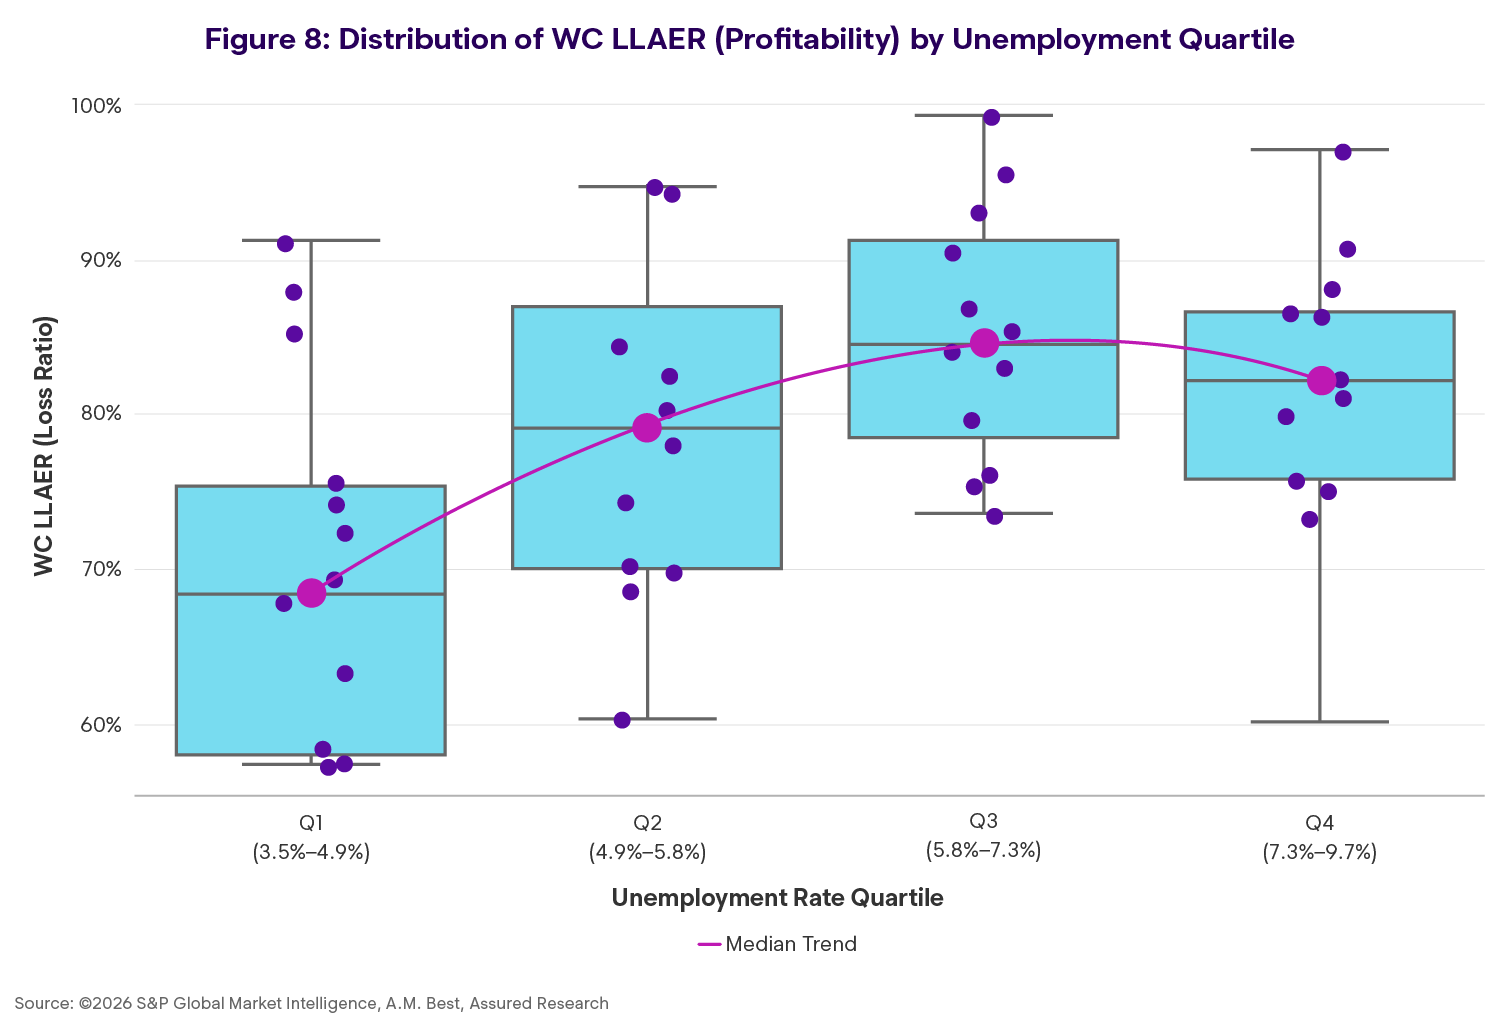
Unemployment ≥ ~4.9% historically corresponds with higher WC loss ratios.
We think members of the Federal Reserve are wearing rose-colored glasses. Their latest projections for 2026 include median forecasts of 2.4% real GDP growth and 4.4% unemployment. We are more bearish on the economy than members of the Fed for three reasons: jobs, jobs, and jobs.
Our thoughts can be framed against the question: what if the Fed is wrong and GDP growth is slower and unemployment is higher than their forecast? We assert with high confidence the economic downgrade would result in lower WC premium growth. But the impact on the WC loss and LAE ratio (LLAER) is more nuanced and “data dependent” as former Chairman Jerome Powell was fond of saying.
Stable(ish) unemployment and a mild miss on the GDP growth rate probably would not have much of an adverse impact on the WC LLAER. But if the unemployment rate rises to say 5% or higher, both historical data and research have shown the WC LLAER would likely come under pressure.
Why? It is true WC claim volumes tend to decline during recessions or periods of slowing economic growth and rising unemployment. But the adverse impact of rising losses (e.g., from longer duration claims owing to fewer return-to-work opportunities) and lower premium volumes during periods of high unemployment tend to drive the loss ratio higher, tempering the favorable impact of fewer claims. These opposing forces (fewer claims, higher losses) dampen one another, but our review of WC loss and GDP growth from 1973 shows WC loss ratios have tended to rise when the unemployment rate reaches 5% or higher. See Figure 8.
To be clear, a 5% unemployment rate would only materialize if nearly all labor market news for the remainder of 2026 was negative; perhaps that is a stretch. But when we consider a prolonged “slow to hire, slow to fire” environment coupled with occasionally large, AI-driven layoffs and a steady stream of college graduates entering the workforce just as entry-level work dries up, that downside scenario does not seem entirely implausible.
Leadership Takeaways
- Frequency declines do not guarantee improved loss ratios in downturn scenarios
- Duration and RTW constraints become primary risk levers when unemployment rises
What to Watch
- Track claim duration and RTW friction indicators during labor softening
- Preplan for operational adjustments if unemployment trends upward
Personal Auto Insurance Had a Year in 2025
SIGNAL
Private passenger auto results were exceptional in 2025, driven by a generationally low physical damage combined ratio and favorable reserve development. With returns abundant and affordability a prominent political issue, rate decreases are becoming more common in 2026; behavior we view as normal and cyclical, and likely to self‑correct over time.
Many personal auto insurers reported exceptional results in 2025. Figure 9 shows the history of combined ratios split between liability and auto physical damage since 2000. During this time, the average combined ratio has been about 100% and the total combined ratio, at around 90% for 2025, is exceptional. Moreover, many of the country’s leading auto insurers reported mid-80s combined ratios and returns on equity above 30%. That’s exceptional!
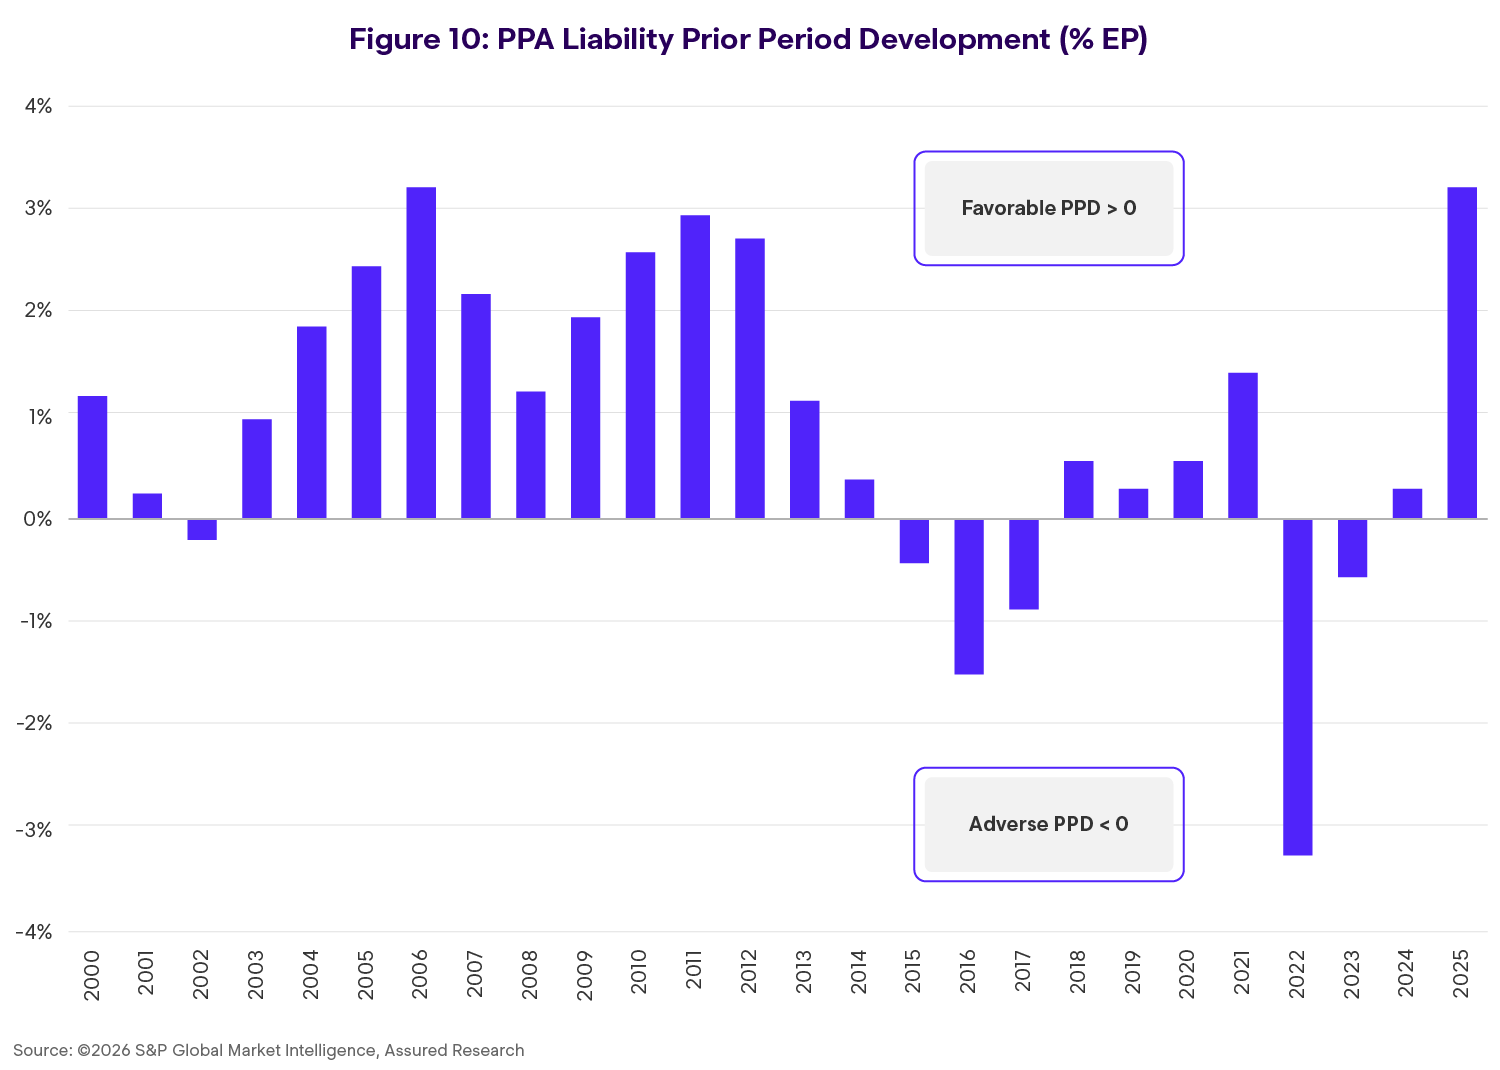
And another point of interest visible in Figure 9: the auto physical damage combined ratio has consistently outperformed the liability combined ratio and typically by six to seven points. That historical gap widened significantly in 2024 and 2025 where the outperformance by physical damage was twice the historical average. And while the liability environment in the US remains difficult, Figure 10 shows that auto insurers are also on top of liability loss trends. Strong favorable reserve development at around 2% of earned premium was the norm until the mid 20-teens with 2022 showing the adverse impact of the post-COVID inflationary spike and driving disruptions that followed. The reserving picture has steadily improved, however, with favorable development in 2025 reported by the vast majority of auto insurers. Our YE25 loss reserving work pointed to meaningful reserve redundancies in auto liability and physical damage reserves. We expect much of those redundancies to flow back through insurers’ income statements in 2026.
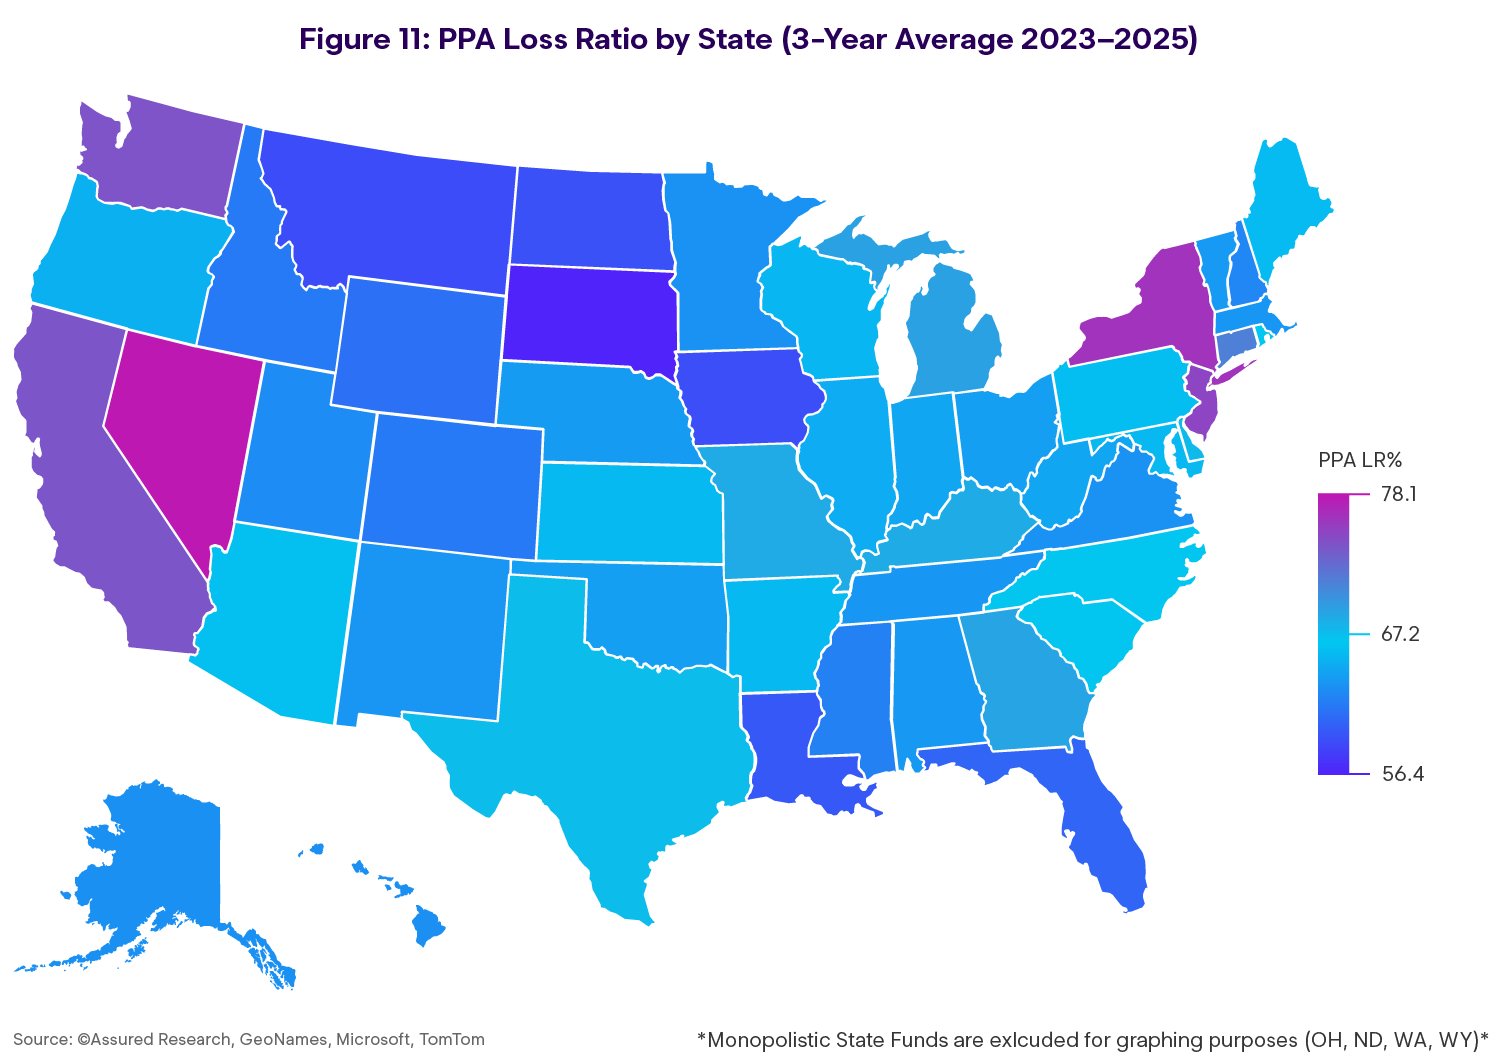
Through the first half of this year auto insurers are in growth mode. Financial results stayed strong through the first quarter, albeit weakening from the historically low combined ratios reported in the second half of 2025, and we'd challenge anybody to watch a sporting event and avoid a commercial inviting them to switch auto carriers. Advertising is ubiquitous.
Leadership Takeaways
- Exceptional profitability typically attracts aggressive competition
- Reserve development and physical damage performance are central to near‑term earnings dynamics
What to Watch
- Monitor market competition indicators (rate actions, growth posture) alongside claim trends
- Track physical damage frequency/severity as consumer coverage choices evolve
2026 Results Likely to Be Good … at a Decelerating Pace
With several leading carriers reporting combined ratios in the 80s and operating returns on equity in the 30s, it’s no surprise that the auto insurance market grows increasingly competitive. Add to that mix affordability concerns that dominate the headlines and it’s also no surprise that auto insurance rate decreases are now commonplace.
We’d characterize this behavior as “normal, cyclical pricing behavior,” to which we put the following issues on readers’ radar screens.
Issue 1: Claiming Behavior Likely to Turn From Tailwind to Headwind
SIGNAL
Softening markets can change both coverage choices and claim propensity.
At some point, the fear of losing one’s coverage or seeing prices raised will give way to frustration that comes with paying for a policy and not using it. And when that happens, the fickle tailwind of underreported auto physical damage claims will turn into a headwind.
In 2024 and 2025, auto insurers benefited from the collision of two macro events:
- As a result of the hard auto insurance market, many policyholders took coverage actions to lower costs—deductibles were increased and some elected to drop comprehensive and collision coverages
- More recently, the high cost of auto insurance collided with an affordability crisis and weakening consumer confidence. We suspect many potential claimants opted to “forget the dent and pay the rent;” auto physical damage claims were underreported
Here is our view on auto claiming behavior as we peer into the 2H26 and 2027.
If the economy surprises to the upside in 2026 and consumers’ financial health (and job security) improve commensurately, we think claiming behavior will turn from tailwind to headwind. First, people would be driving more. Second, some policyholders that dropped physical damage coverage in the years since 2022 will add them back. That dynamic increases auto premiums but also reported claims. It is our view that people’s propensity to file a claim will increase if they become less concerned with either:
- Paying more or losing coverage if a claim is filed, and
- Their financial health and ability to meet their auto deductible improves
If the economy surprises to the downside and if consumers’ financial health weakens, then we would call a jump ball as to predicting changes in claiming behavior. However, even in this scenario we think the tailwind provided by the prevailing “forget the dent and pay the rent” mentality could erode. At some point the fear of losing one’s coverage or seeing prices raised after a claim is reported will give way to the frustration that comes with paying for a policy and not using it. And when that happens, the fickle tailwind of underreported auto physical damage claims will turn into a headwind.
Leadership Takeaways
- Coverage mix and deductible choices can move frequency quickly
- Reporting behavior is a meaningful swing factor when affordability pressure eases
What to Watch
- Track deductible distribution and coverage mix (comp/collision take‑up) as leading indicators
- Watch claim reporting rates for smaller severity bands for early inflection points
Issue 2: Cars With Advanced Safety Features Grow Increasingly Common
SIGNAL
Technology shifts create offsetting forces: frequency down, severity pressure persists.
A lot can happen over the next 25 years, but with many predicting that by 2050 we’ll either be 1) in flying cars, 2) on the ground but in fully autonomous vehicles, or 3) driving but wrapped in a cocoon of safety features, only the latter seems highly likely to materialize. Predictions 1 and 2 cannot be ruled out, but auto executives and boards of directors challenged to address realistic future scenarios should probably focus on 3.
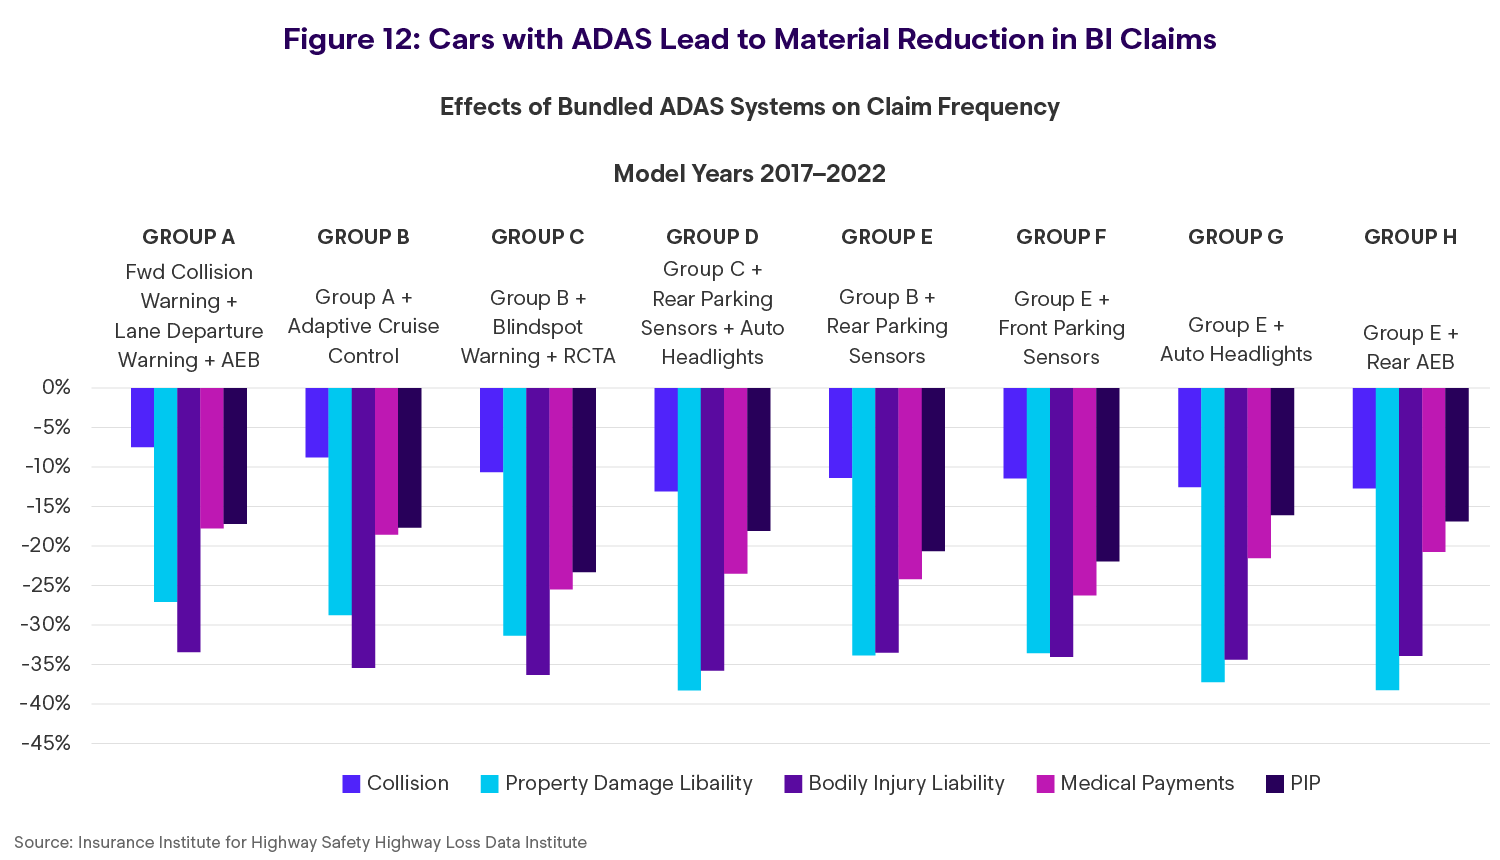
In recent research focused on trends in claims with an auto bodily injury (BI) feature, we posed three future scenarios, each anchored in modeling the proliferation of cars with advanced driver assistant systems (ADAS) and incorporating the Insurance Institute for Highway Safety’s (IIHS) studies demonstrating that drivers of cars with ADAS are 30% less likely to be involved in a bodily injury claim (see Figure 12).
As background for our scenarios, we’ll share that auto BI claims have remained flattish over the past 30 years at about 18 million per annum. We assume that cars with ADAS, at somewhere near 1/3 of the auto fleet today, will rise to near 80% over the next 12 or so years and to virtually 100% by 2050.
And one more: An important source of differentiation across our scenarios is the impact of the network effect, referring to the compounding benefit to all drivers as cars with ADAS rise (think of this as having similarities to herd immunity in virology).
In our first scenario through 2050, auto liability claims remain flattish, as they have over the past ~30 years, and auto premium grow with inflation plus a modest “litigation kicker” much like the 4% CAGR in “PPAL” (private passer auto liability) premium growth since 1996. The network effect is modest in this scenario (perhaps dampened by those who turn the safety features off, or who think ADAS means it’s OK to text and drive).
In a second scenario, Auto BI claims could decrease by ~10-15% as cars with ADAS proliferate and safety-compounding benefits materialize. In this scenario, it seems highly probable auto BI premium growth slows from the historic 4% level as claim volumes and accident rates moderate.
And in a third scenario, where the network effect proves consequential (and people get the message — hands free but eyes on the road), auto BI claims could decrease by 20% or more over the next 25 years. If that seems aggressive, consider that, incredibly, there are 60% fewer workers’ compensation claims today when compared to the mid-1990s. It is widely understood that fewer auto BI claims means those reported will be more severe, but we still think that aggregate losses, and therefore premiums, would decrease in this scenario.
Leadership Takeaways
- Auto BI frequency could decline over time, but outcome depends on adoption + behavior + network effects
- Lower auto BI frequency can coincide with higher per‑claim severity; aggregate impacts require claims‑level evidence
What to Watch
- Treat ADAS as a strategic uncertainty driver for long‑range BI planning
- Use Sections 2–3 claims data to quantify net effects across frequency, severity, and cost categories
Conclusion
The macro environment facing property and casualty insurers in 2026 is neither unfamiliar nor uniform. Strong recent performance has expanded capital and increased competitive pressure, while economic uncertainty and policy shifts introduce new variability. For workers’ compensation and personal auto, two of the most profitable lines in 2025, profitability may persist in 2026 but the conditions supporting recent results are evolving in ways that increase complexity and reduce predictability.
Market‑level indicators (profitability, premium growth, rate movements) provide essential context, but they do not reveal where pressure is building — or where resilience is holding — inside claims. To understand how pricing pressure and complexity translate into real performance, the lens must narrow. In the sections that follow, Enlyte experts will look at auto and workers’ comp claim data and severity drivers, to examine how these macro signals are manifesting at the claim and segment level — where decisions are made and outcomes are determined.
Implications for P&C Leaders From Tailwind to Headwind
- Pricing pressure is a capital story as much as a loss story.
Strong results and expanding surplus create structural competitive pressure; demand sensitivity increases when capital is abundant - “One cycle” thinking is less reliable; divergence by line is increasing.
Rate correlation persists, but variance across lines has widened - WC remains profitable, but tailwinds are shifting. Watch the wage/medical gap, policy‑driven cost shifting, and labor market sensitivity (duration + LLAER)
- Personal auto is normalizing under competitive pressure.
Expect behavioral dynamics (deductibles/coverage/reporting) to matter as much as baseline loss trends - Technology introduces long‑horizon uncertainty.
ADAS can reduce BI frequency under multiple scenarios; severity offsets and net outcomes require claims‑level validation