
Workers’ Compensation Understanding What’s Driving Severity
What's happening inside claims is changing. Explore how medical utilization, behavioral health, and claim complexity are driving cost, duration, and outcomes.
State Level Observations
Largest Workers’ Compensation Medical Markets
Hover over areas on the map to learn more.
Medical Claim Data: Utilization, Access and Geographic Variation
Medical severity is rising as injured workers receive more services per claim, even as overall treatment duration remains relatively stable. At the same time, access to care and treatment patterns vary widely by setting and geography — shaping cost, outcomes, and the overall claim experience.
Top 10 Averages
$11,443 Charge per Claimant
$5,121 Allowed per Claimant
60.5 Treatment Length (Days)
109.0 Units per Claimant
Confounding Factors: Complexity Compounds Quickly
Most case-managed claims involve one or more confounding factors, each increasing duration and cost. As these factors accumulate, claims become more difficult to manage, reinforcing the need for proactive, coordinated case management strategies.
Click on the icon to see the difference.
Behavioral Health: A Multiplier of Cost and Duration
Claims involving behavioral health treatment show significantly higher medical costs and longer durations than those without. These claims represent a critical driver of complexity and require earlier identification and targeted intervention.
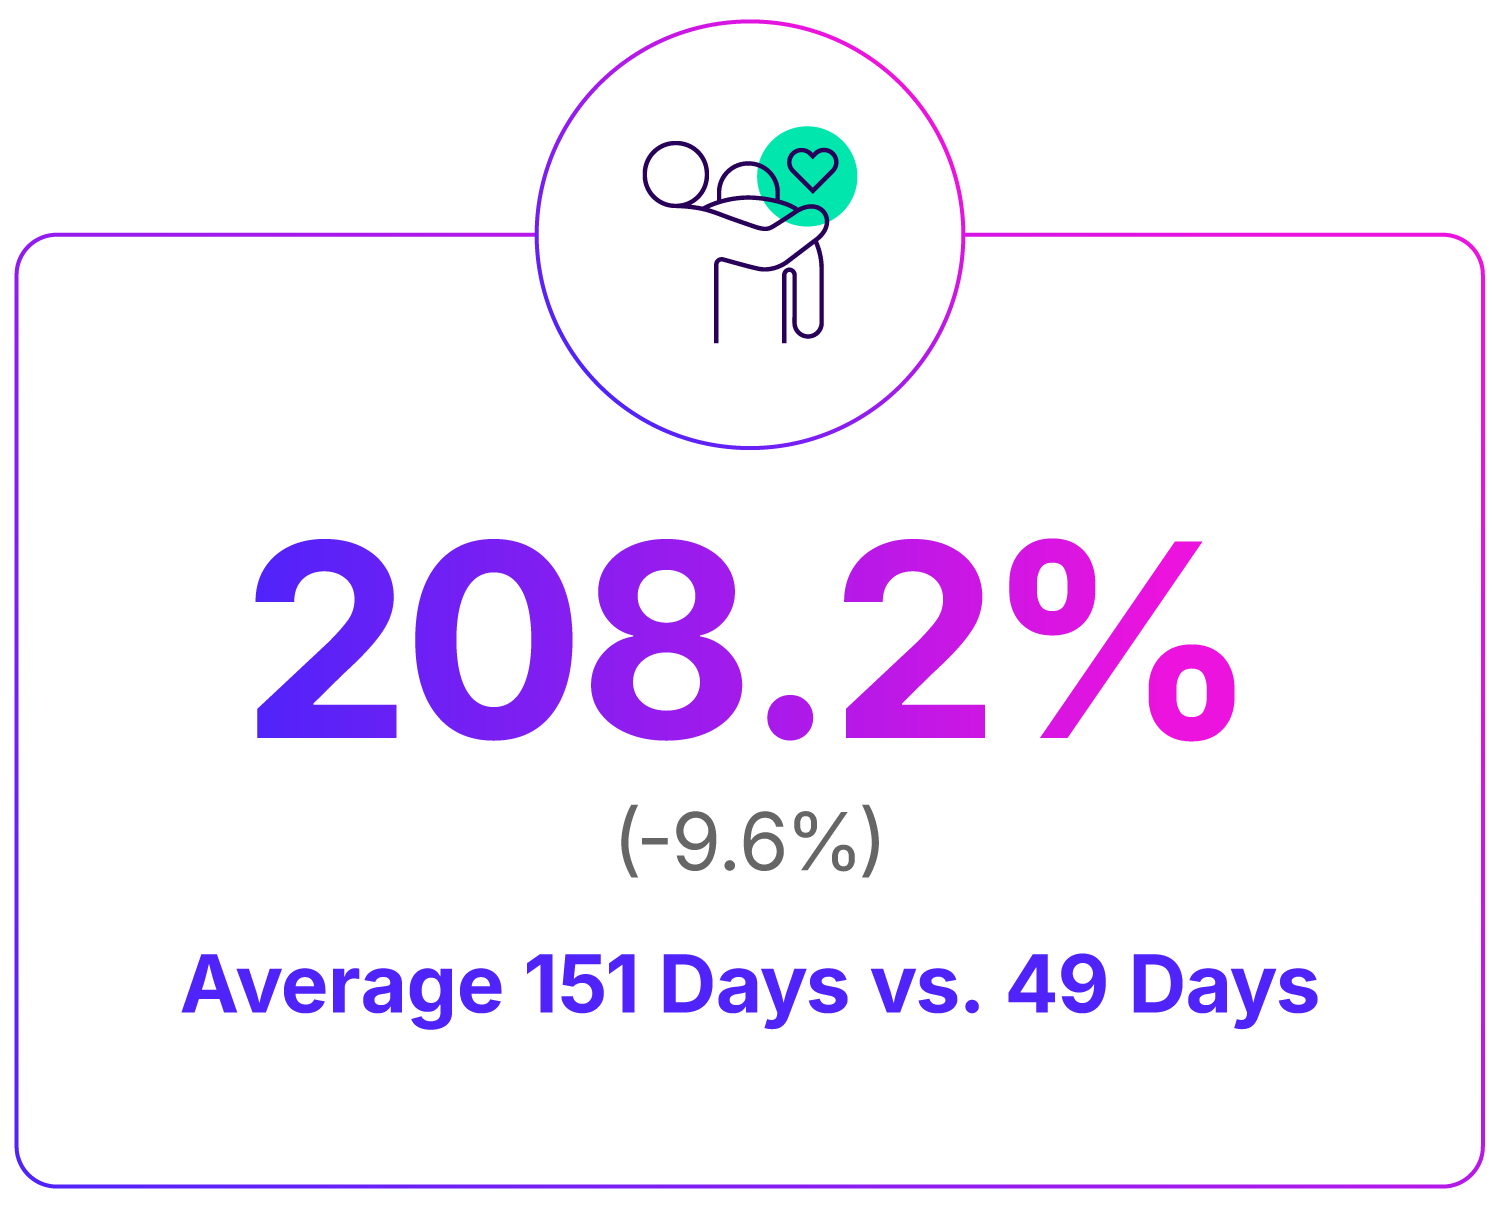
Longer Treatment Duration with Behavioral Health
Florida Fee Schedule: Policy Changes with Immediate Impact
The 2025 Florida Fee Schedule changes are driving measurable increases in reimbursement across key services. These shifts highlight how regulatory changes can quickly influence cost dynamics — and why continuous monitoring at the state level is essential.
Common Non-Hospital Utilization Categories and CPT Codes
*CPT 97110 - Physical Medicine and Rehab. Therapeutic Procedures
**CPT 73630 - Diagnostic Radiology Procedures of Lower Extremities
***CPT 99124 - Established Patient
Average Change to Recommended Payment per Bill
+21.1%
$224/Bill → $271/Bill
Average Change to Provider Charges per Bill
+0.6%
$534/Bill → $537/Bill
Average Change to Gross Savings Percentage
-14.8%
58.0% → 49.4%
Average Recommended Payment per Treatment
Physical Medicine
Radiology & Diagnostics
Evaluation & Management
Navigate the Insights
Each section breaks down key trends with data, analysis, and recommendations.